
Tag: graph
-
Undergraduate | Submission 3 – Third Place
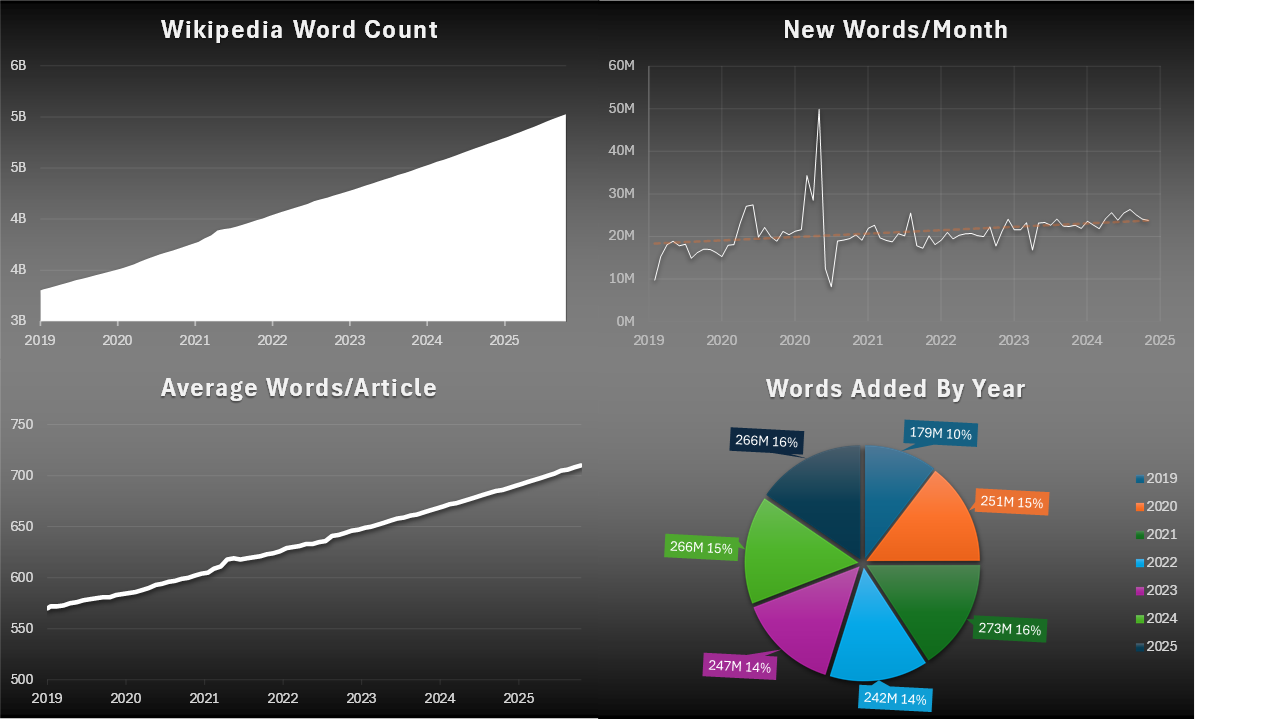
Creator: Christopher Horak Creator Statement: I simply wanted to use excel and implement different charts to showcase an interesting set of online data. I used data about the amount of wikipedia words from 2019 to 2025. This was mainly to explore some excel formatting and functionalities. I was trying to show the linear increase in…
-
Undergraduate | Submission 2
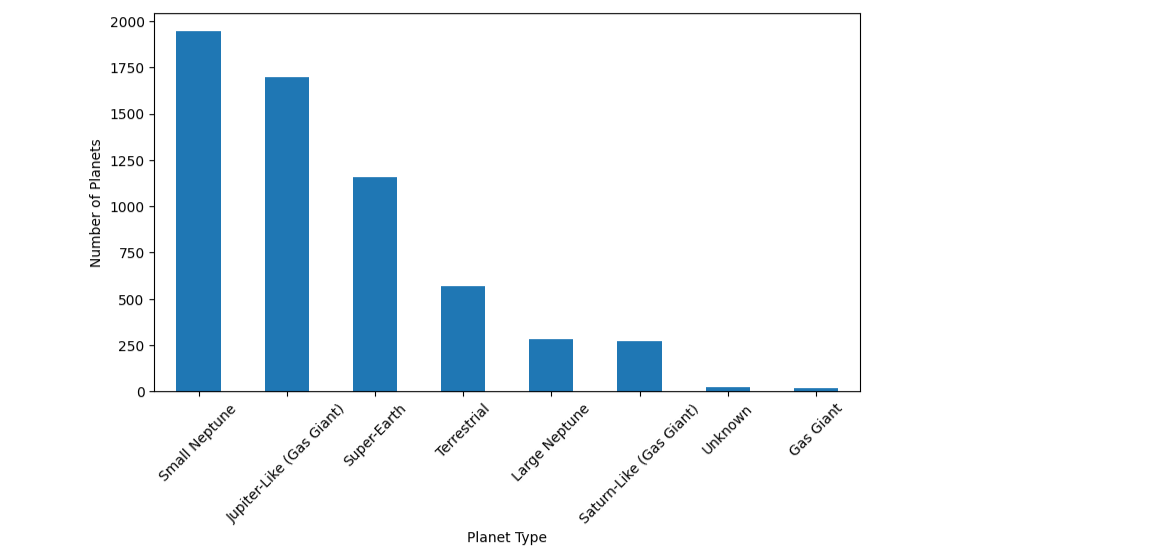
Creator: Ellie Webb Creator Statement: The data used belongs to NASA and Caltech – it is their massive dataset of exoplanet observations. This dataset includes values such as luminosity (star brightness) and orbital distance. In this project, I was able to take the value of planetary radius and use it to classify known exoplanets based…
-
Graduate | Submission 3
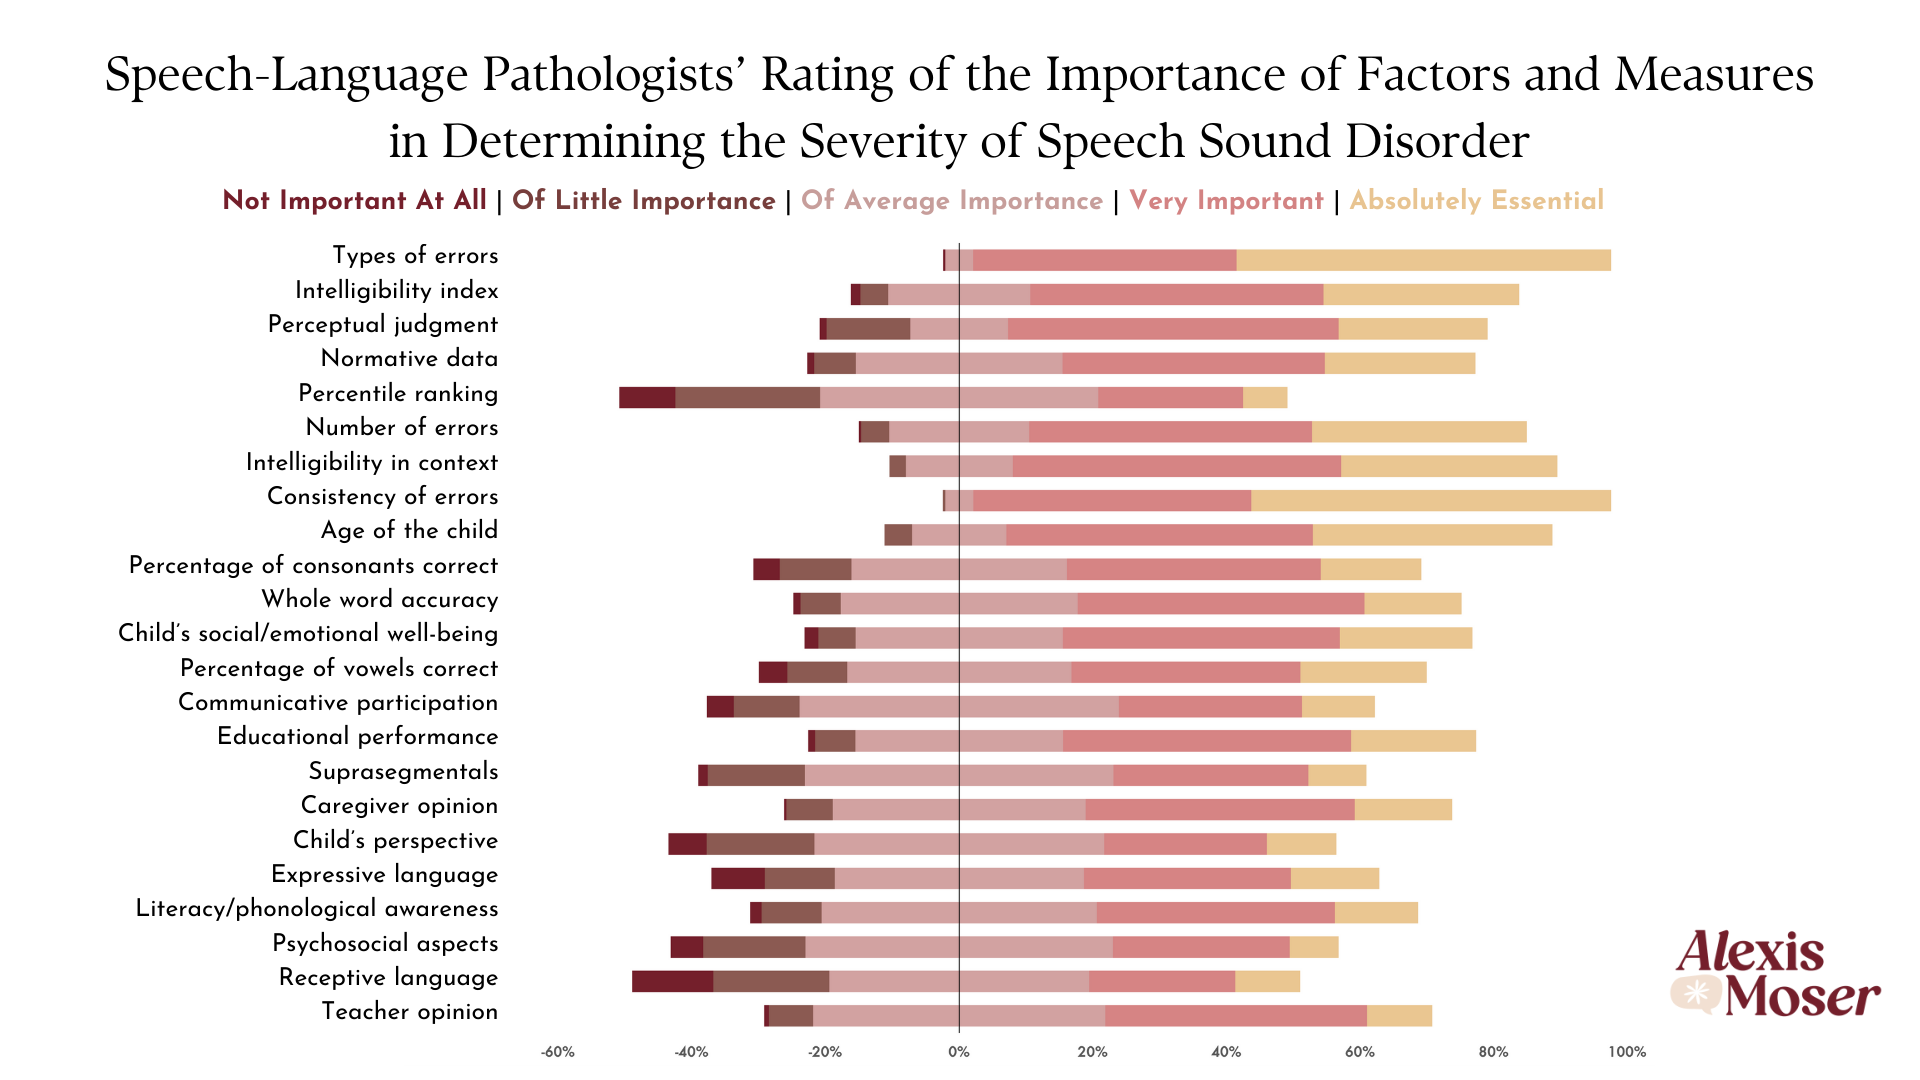
Creator: Alexis Moser Creator Statement: This data visualization presents unpublished results from my master’s thesis examining speech-language pathologists’ (SLPs’) perceptions of the severity of speech sound disorder (SSD). Through a national survey, SLPs (n = 296) rated the importance of 23 different factors and measures in determining SSD severity using a Likert scale ranging from…
