
Creator: Taniya Saker
Creator Statement:
Climate disasters are becoming more frequent and more damaging, but recovery is not experienced equally by everyone. This visualization explores a simple but important question: who recovers after climate disasters and who does not?
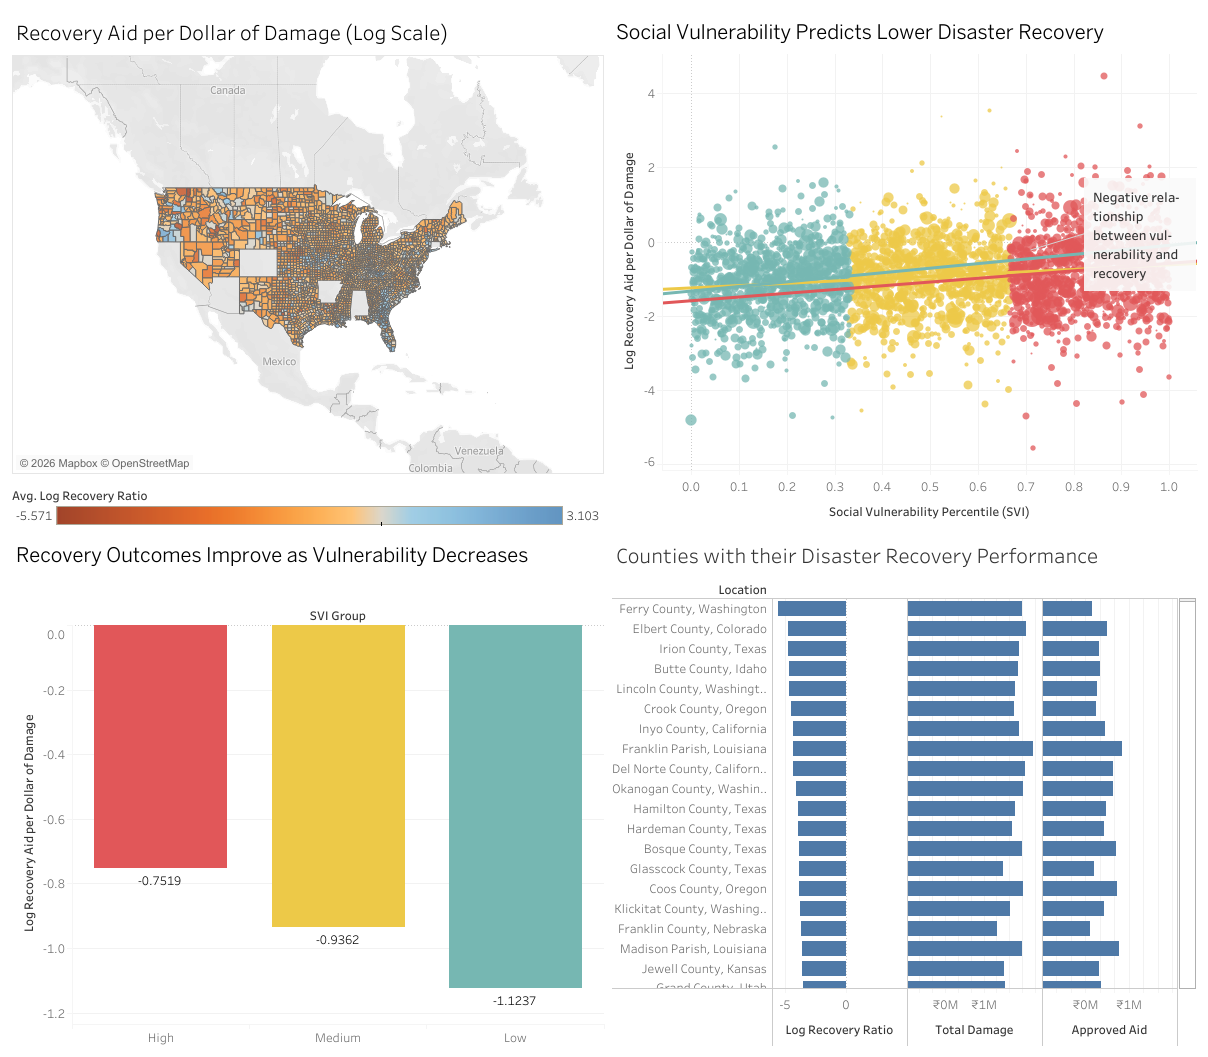
The dashboard combines three publicly available datasets: disaster damage from NOAA Storm Events, recovery assistance from FEMA’s Individual Assistance program, and the county-level CDC Social Vulnerability Index. By comparing disaster damage with recovery aid at the county level, the visualization shows how recovery outcomes vary across communities with different social and economic conditions.
The story that emerges is clear. Counties with higher social vulnerability, those facing greater challenges related to income, housing, health, and access to resources, consistently receive less recovery aid per dollar of disaster damage. This pattern appears across maps, comparisons, and county rankings, revealing an inequality that is often hidden behind national averages.
I was inspired to create this visualization after noticing that conversations about climate resilience often focus on physical risk, but rarely on social recovery. This project aims to make recovery inequality visible, measurable, and understandable to a broad audience.
The goal of this visualization is not only to show where disasters happen, but to highlight how vulnerability shapes recovery and to encourage more equitable thinking about climate resilience, disaster response, and community support.
