
Category: 2026 Graduate
-
Graduate | Submission 6 – First Place
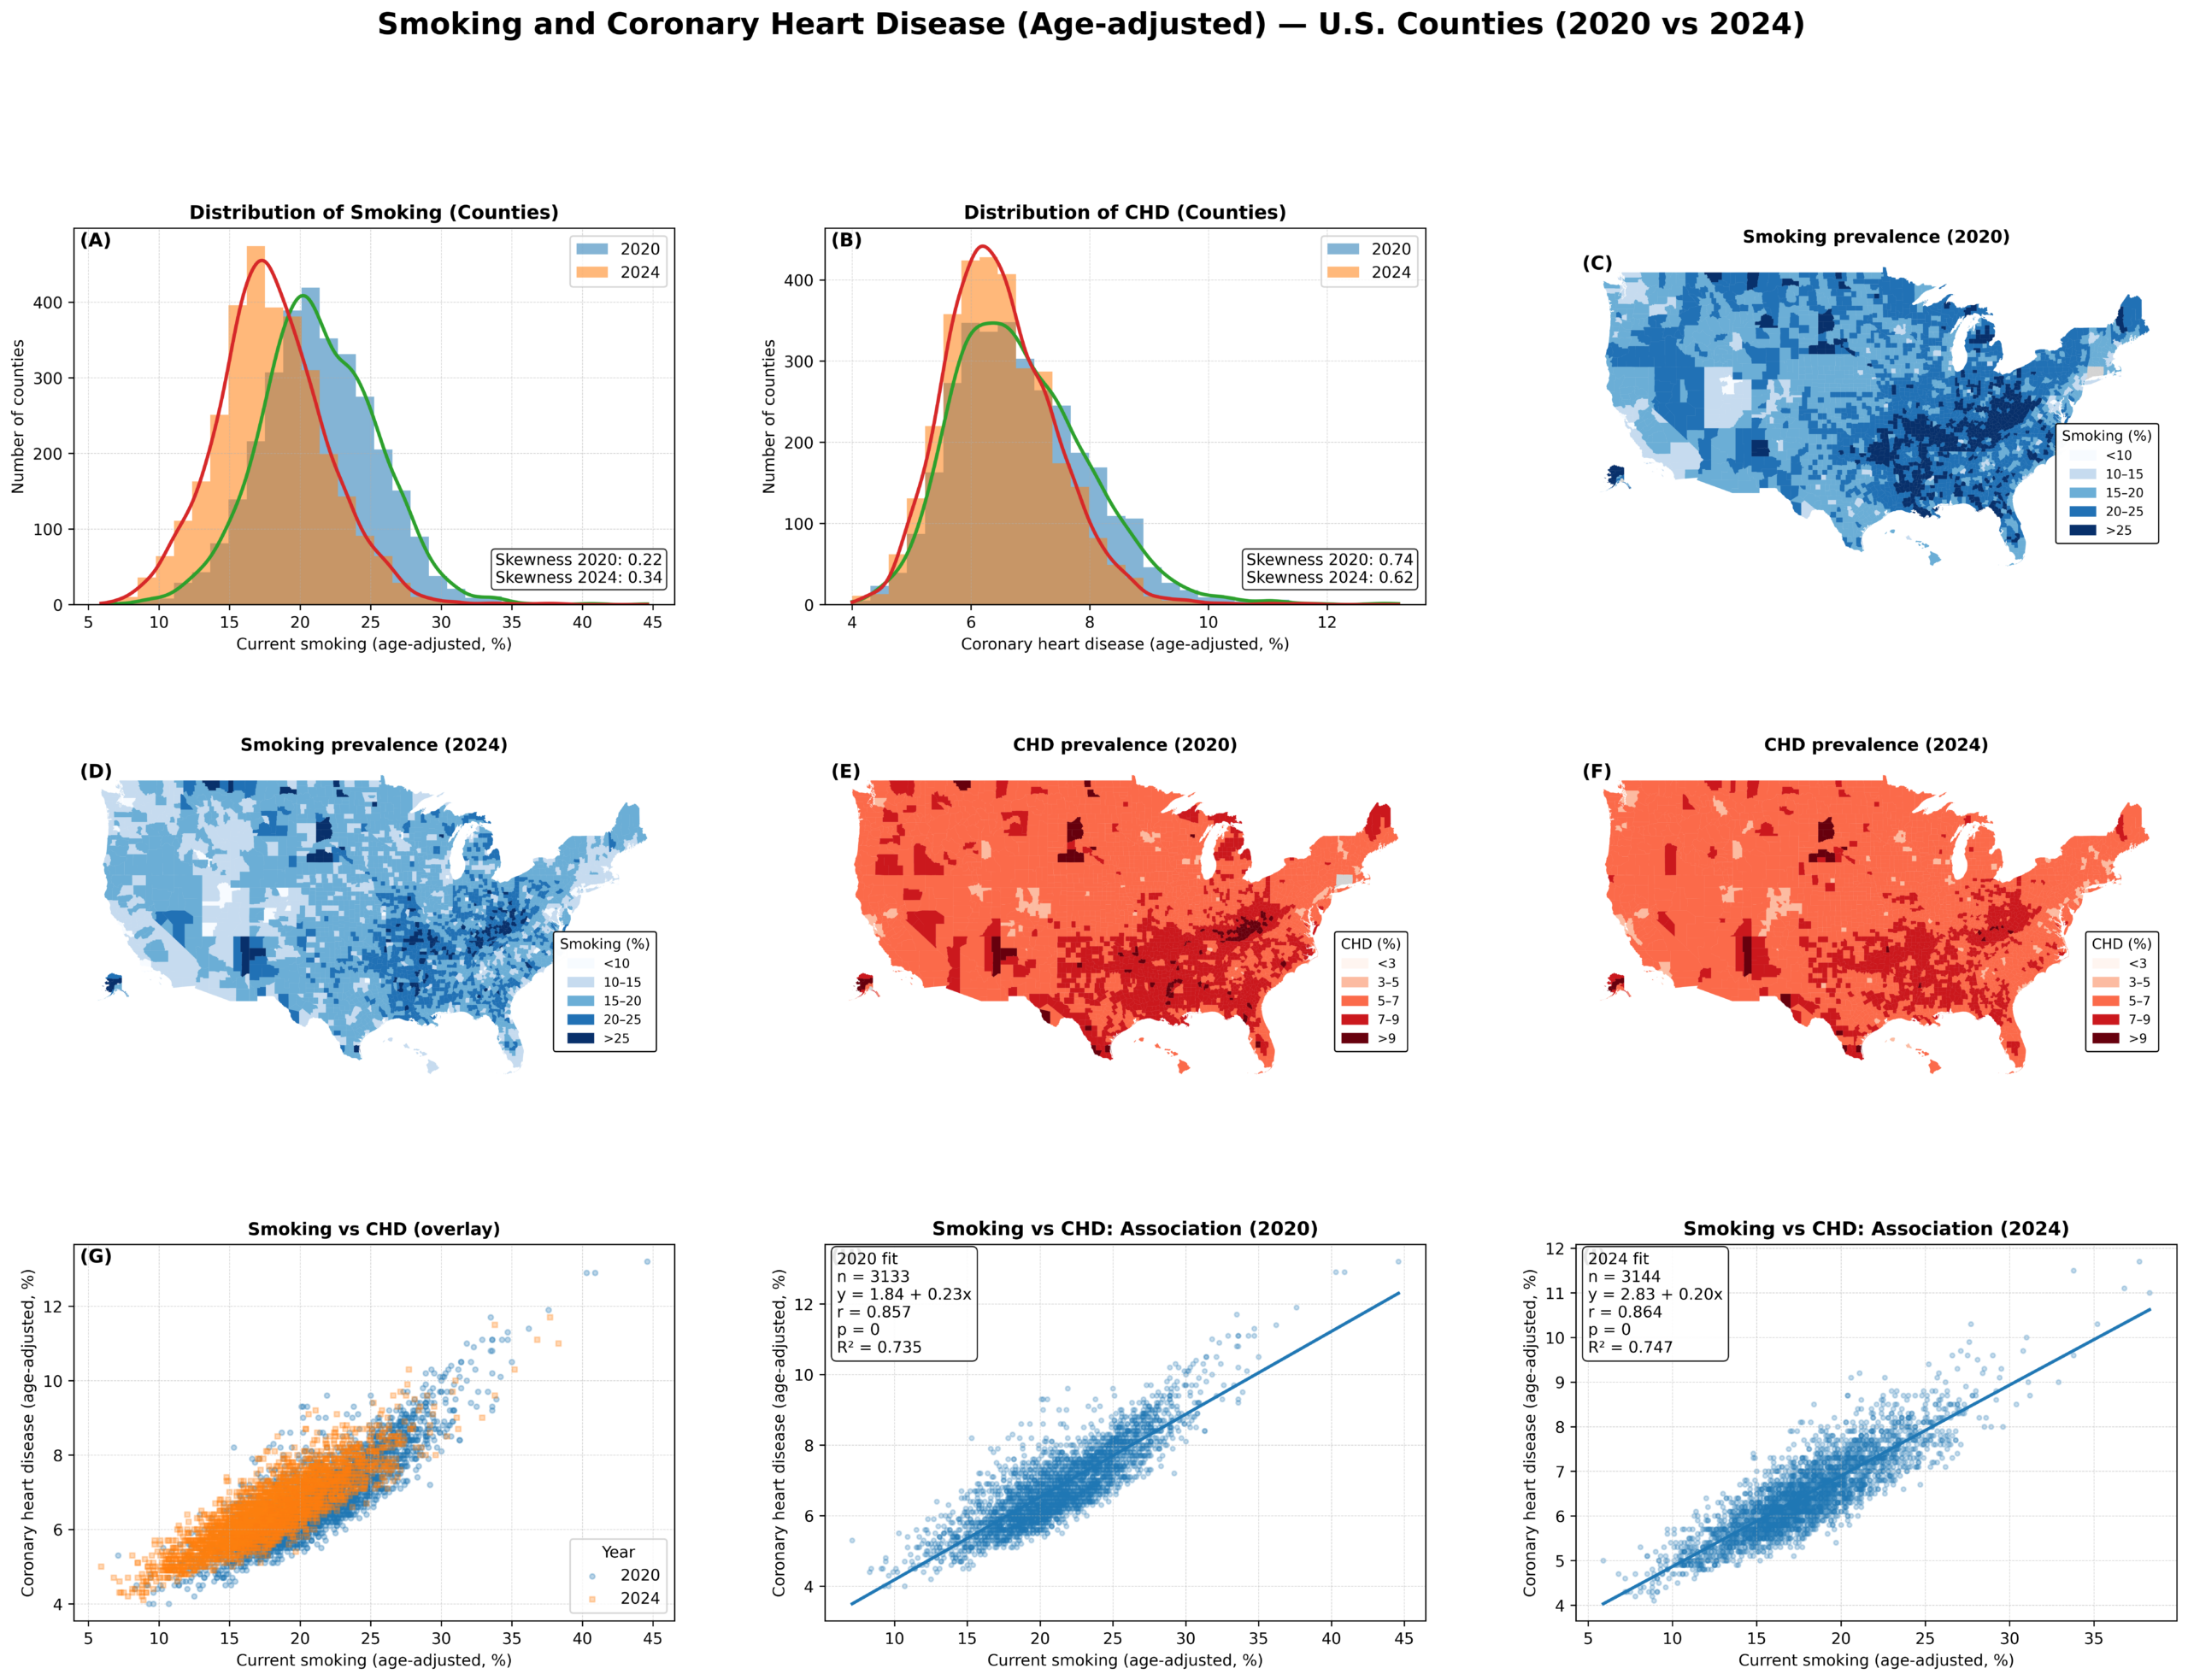
Creator: Stephen Liwur Creator Statement: This visualization analyzes how cigarette smoking and coronary heart disease are spatially distributed across U.S. counties and how closely the two outcomes are connected over time. Smoking, according to existing studies (e.g., Alhindal et al., 2025; CDC, 2024), is a major and well-established risk factor for cardiovascular disease, yet its…
-
Graduate | Submission 5 – Third Place
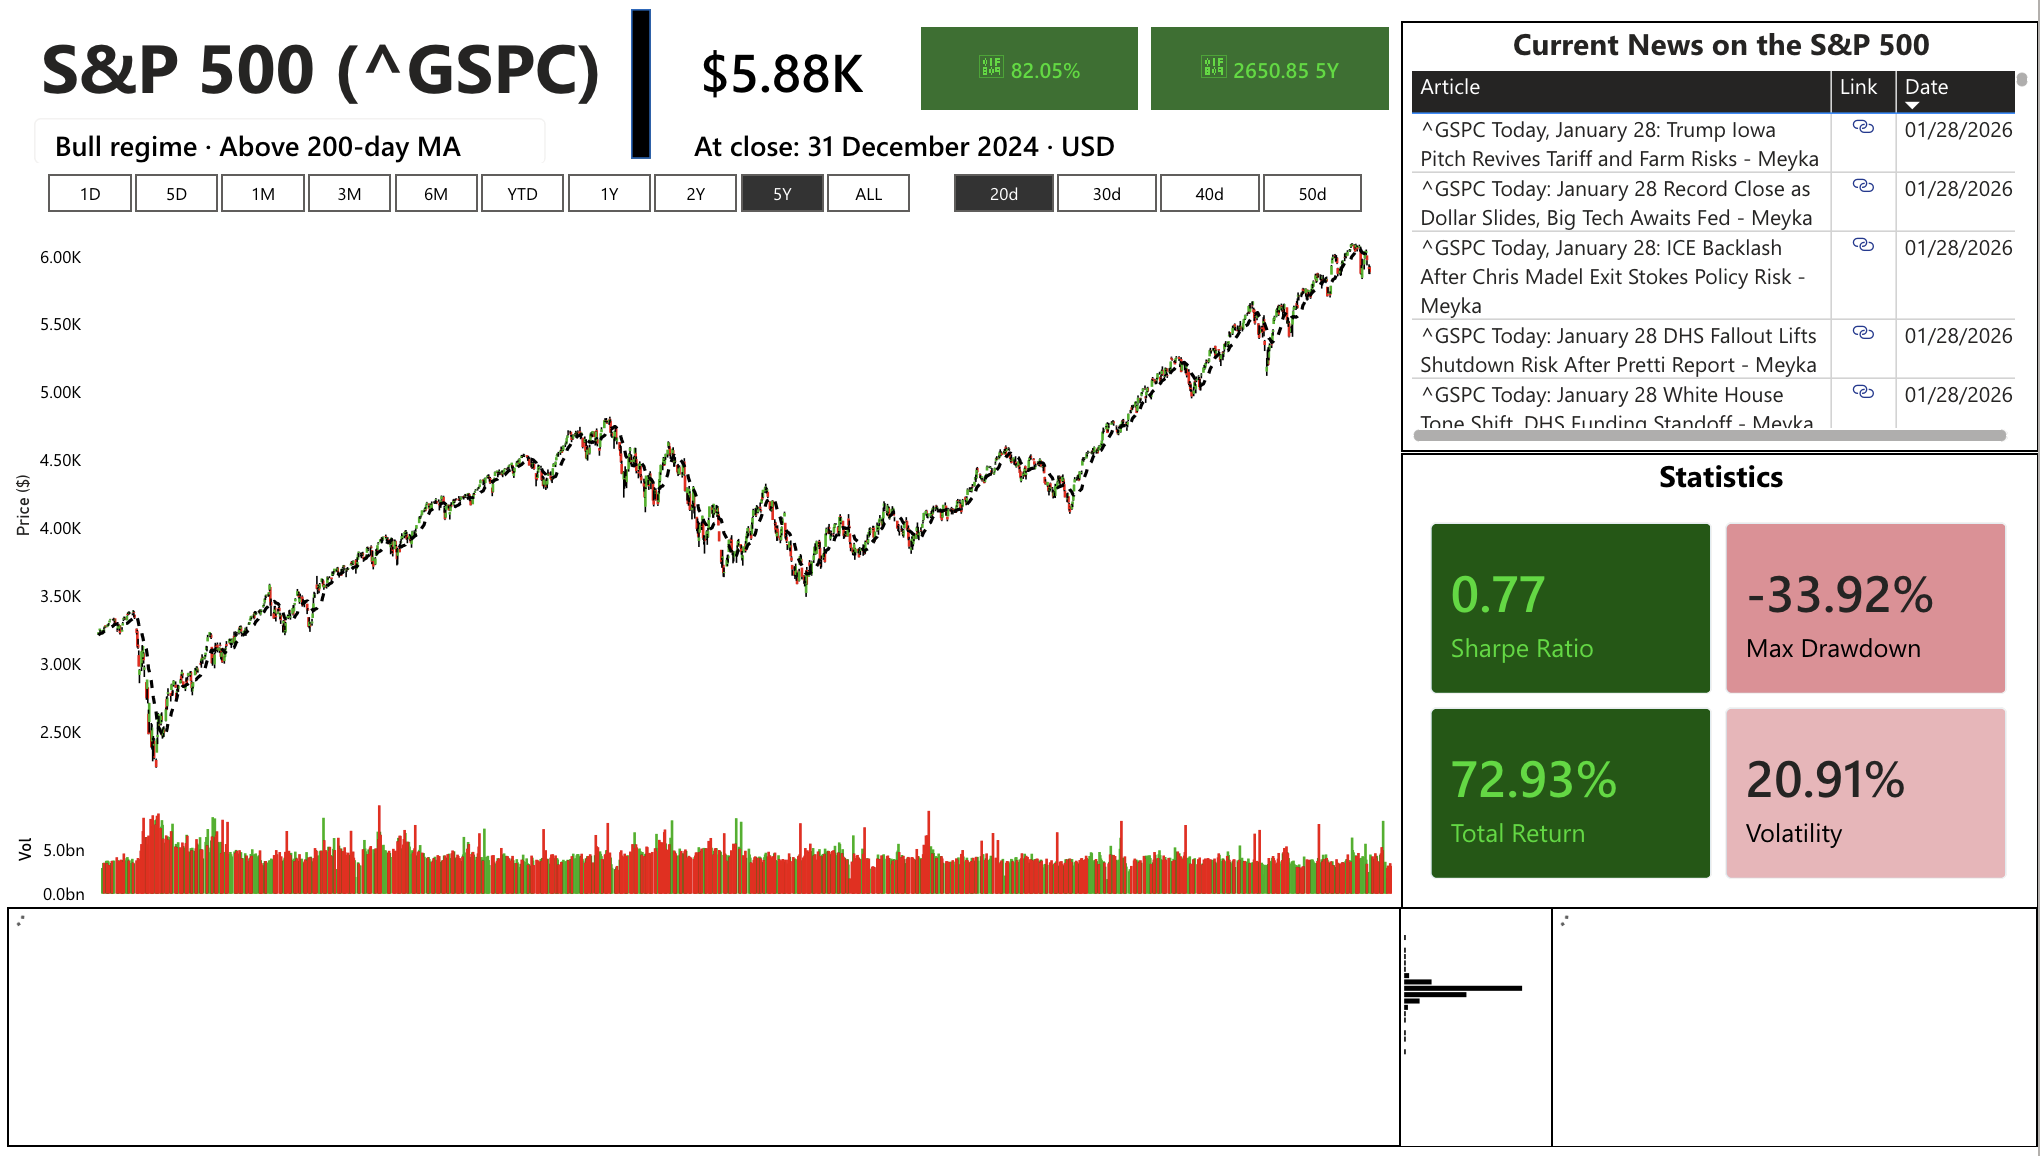
Creator: Dennis Houlihan Note on data: Stock data was taken from yahoo finance via python through the yfinance package with the dates specified. Creator Statement: This dashboard was an attempt to provide a user easy-to-use and digestible visualizations and statistics to help them understand and analyze the S&P 500. The data is comprised of open,…
-
Graduate | Submission 4
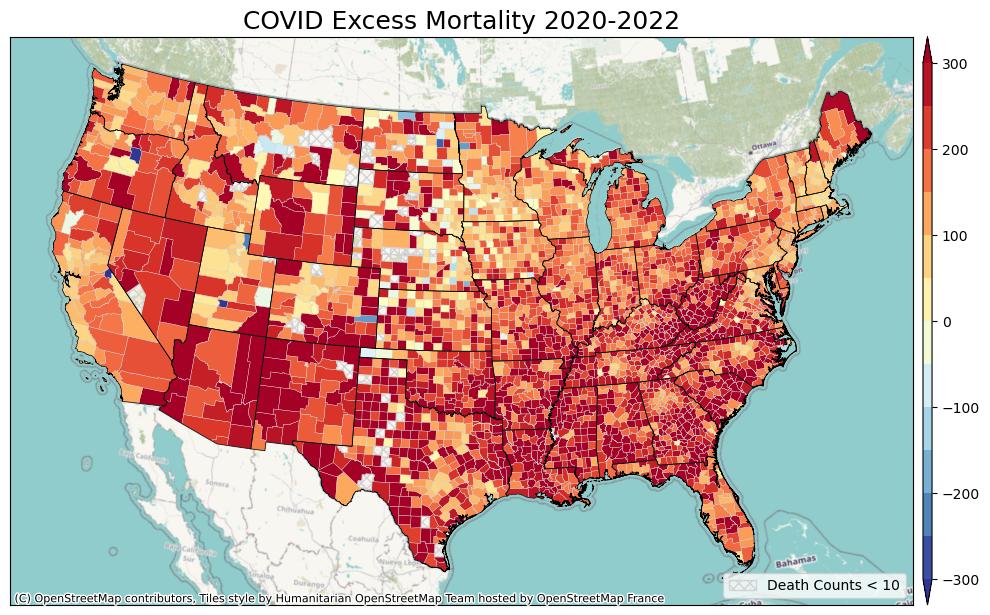
Creator: Chen-Lun Kao & Stewart Fotheringham Creator Statement: Most prior COVID-19 research has focused on disease incidence, rather than excess mortality, which provides a more comprehensive measure of the pandemic’s impact. The accuracy of officially reported COVID-19 deaths has been affected by factors such as limited testing capacity, evolving case definitions, and reporting delays, especially…
-
Graduate | Submission 3
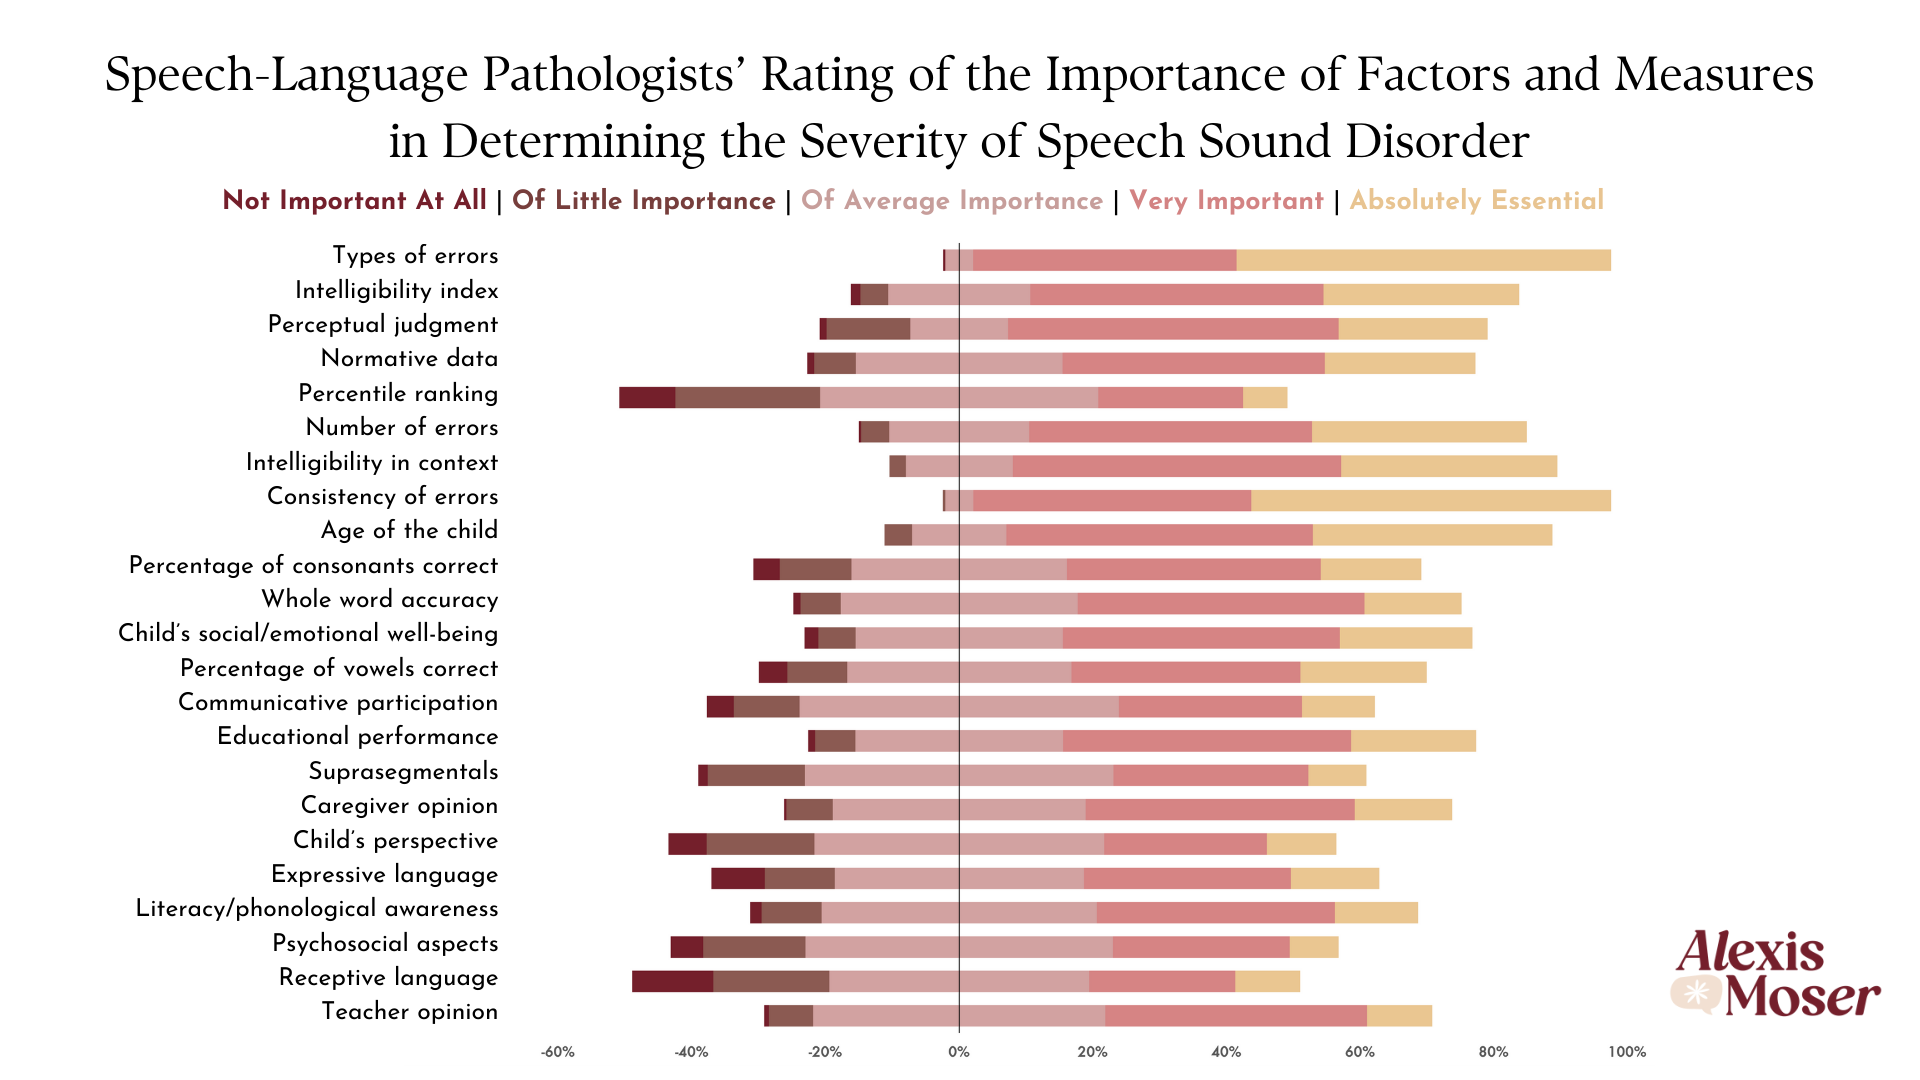
Creator: Alexis Moser Creator Statement: This data visualization presents unpublished results from my master’s thesis examining speech-language pathologists’ (SLPs’) perceptions of the severity of speech sound disorder (SSD). Through a national survey, SLPs (n = 296) rated the importance of 23 different factors and measures in determining SSD severity using a Likert scale ranging from…
-
Graduate | Submission 2
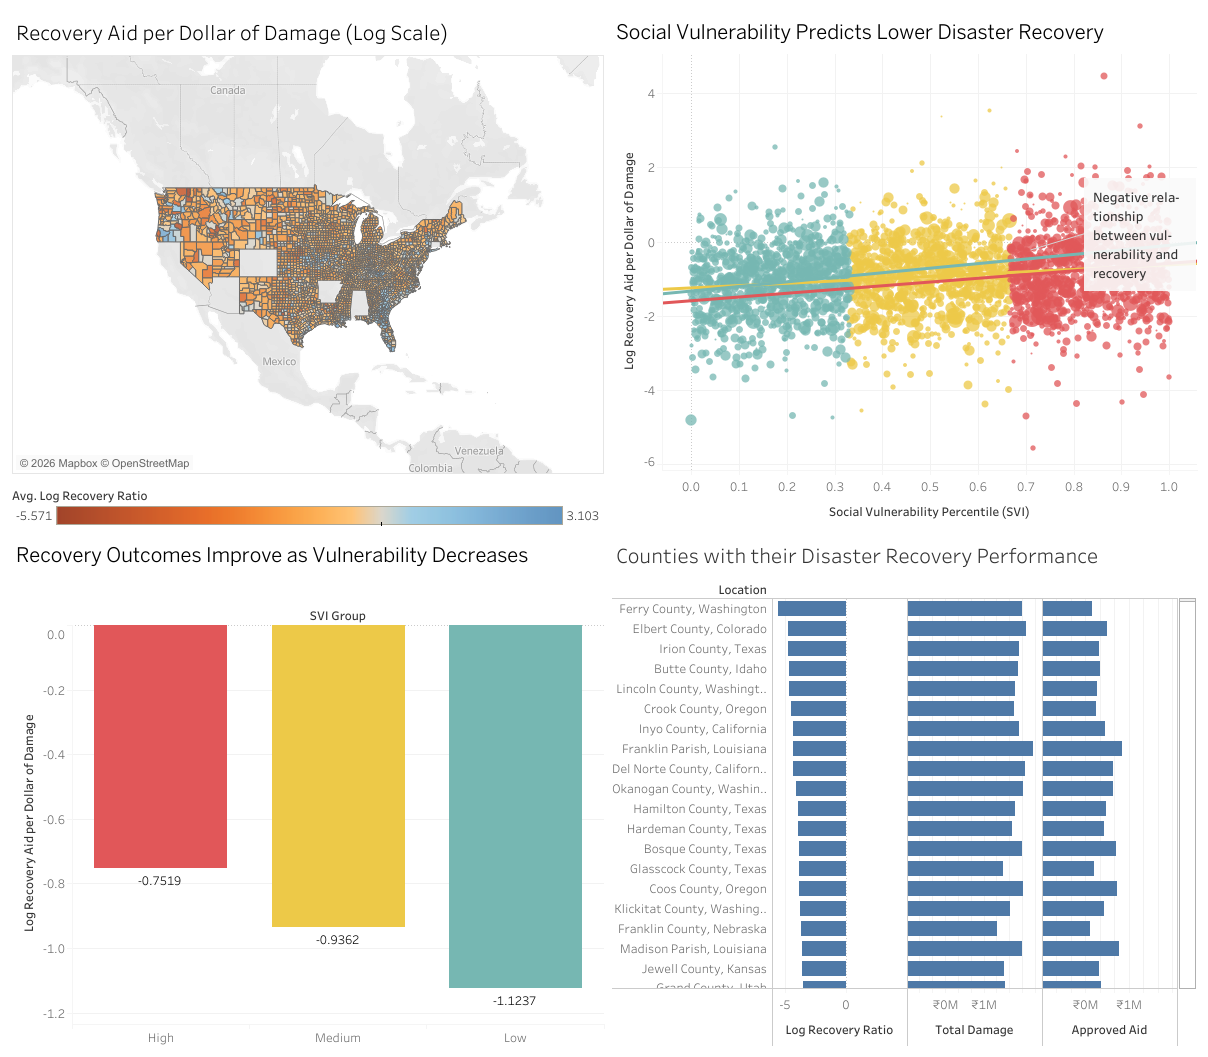
Creator: Taniya Saker Creator Statement: Climate disasters are becoming more frequent and more damaging, but recovery is not experienced equally by everyone. This visualization explores a simple but important question: who recovers after climate disasters and who does not? The dashboard combines three publicly available datasets: disaster damage from NOAA Storm Events, recovery assistance from FEMA’s…
-
Graduate | Submission 1 – Second Place
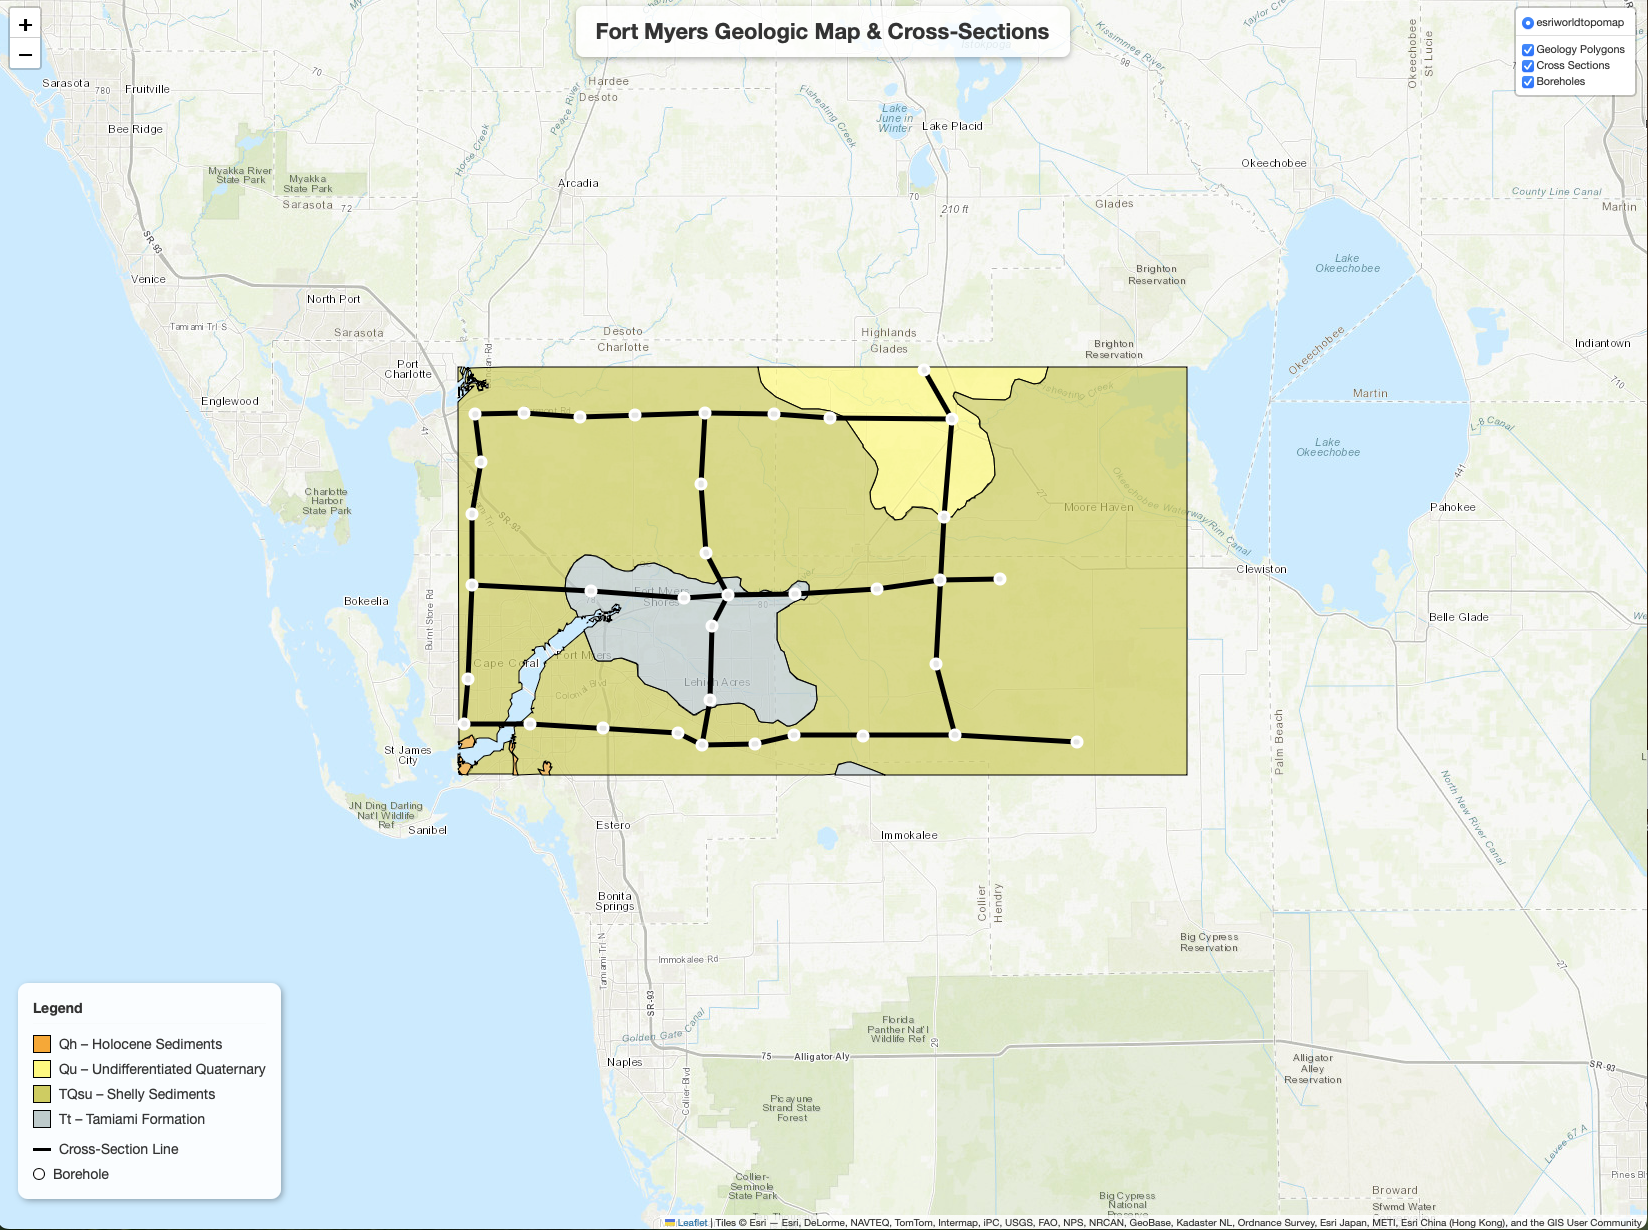
Creator: Sean Jones Creator Statement: I created an interactive map of the geology found in the Fort Myers quadrangle using only python and html programming code. In this interactive map, you can click on any geologic formation and a pop-up showing the description will appear. The depths and formations found in each borehole also appear…
