
Creator: Sage Quillen
Source Data:
Creator Statement:
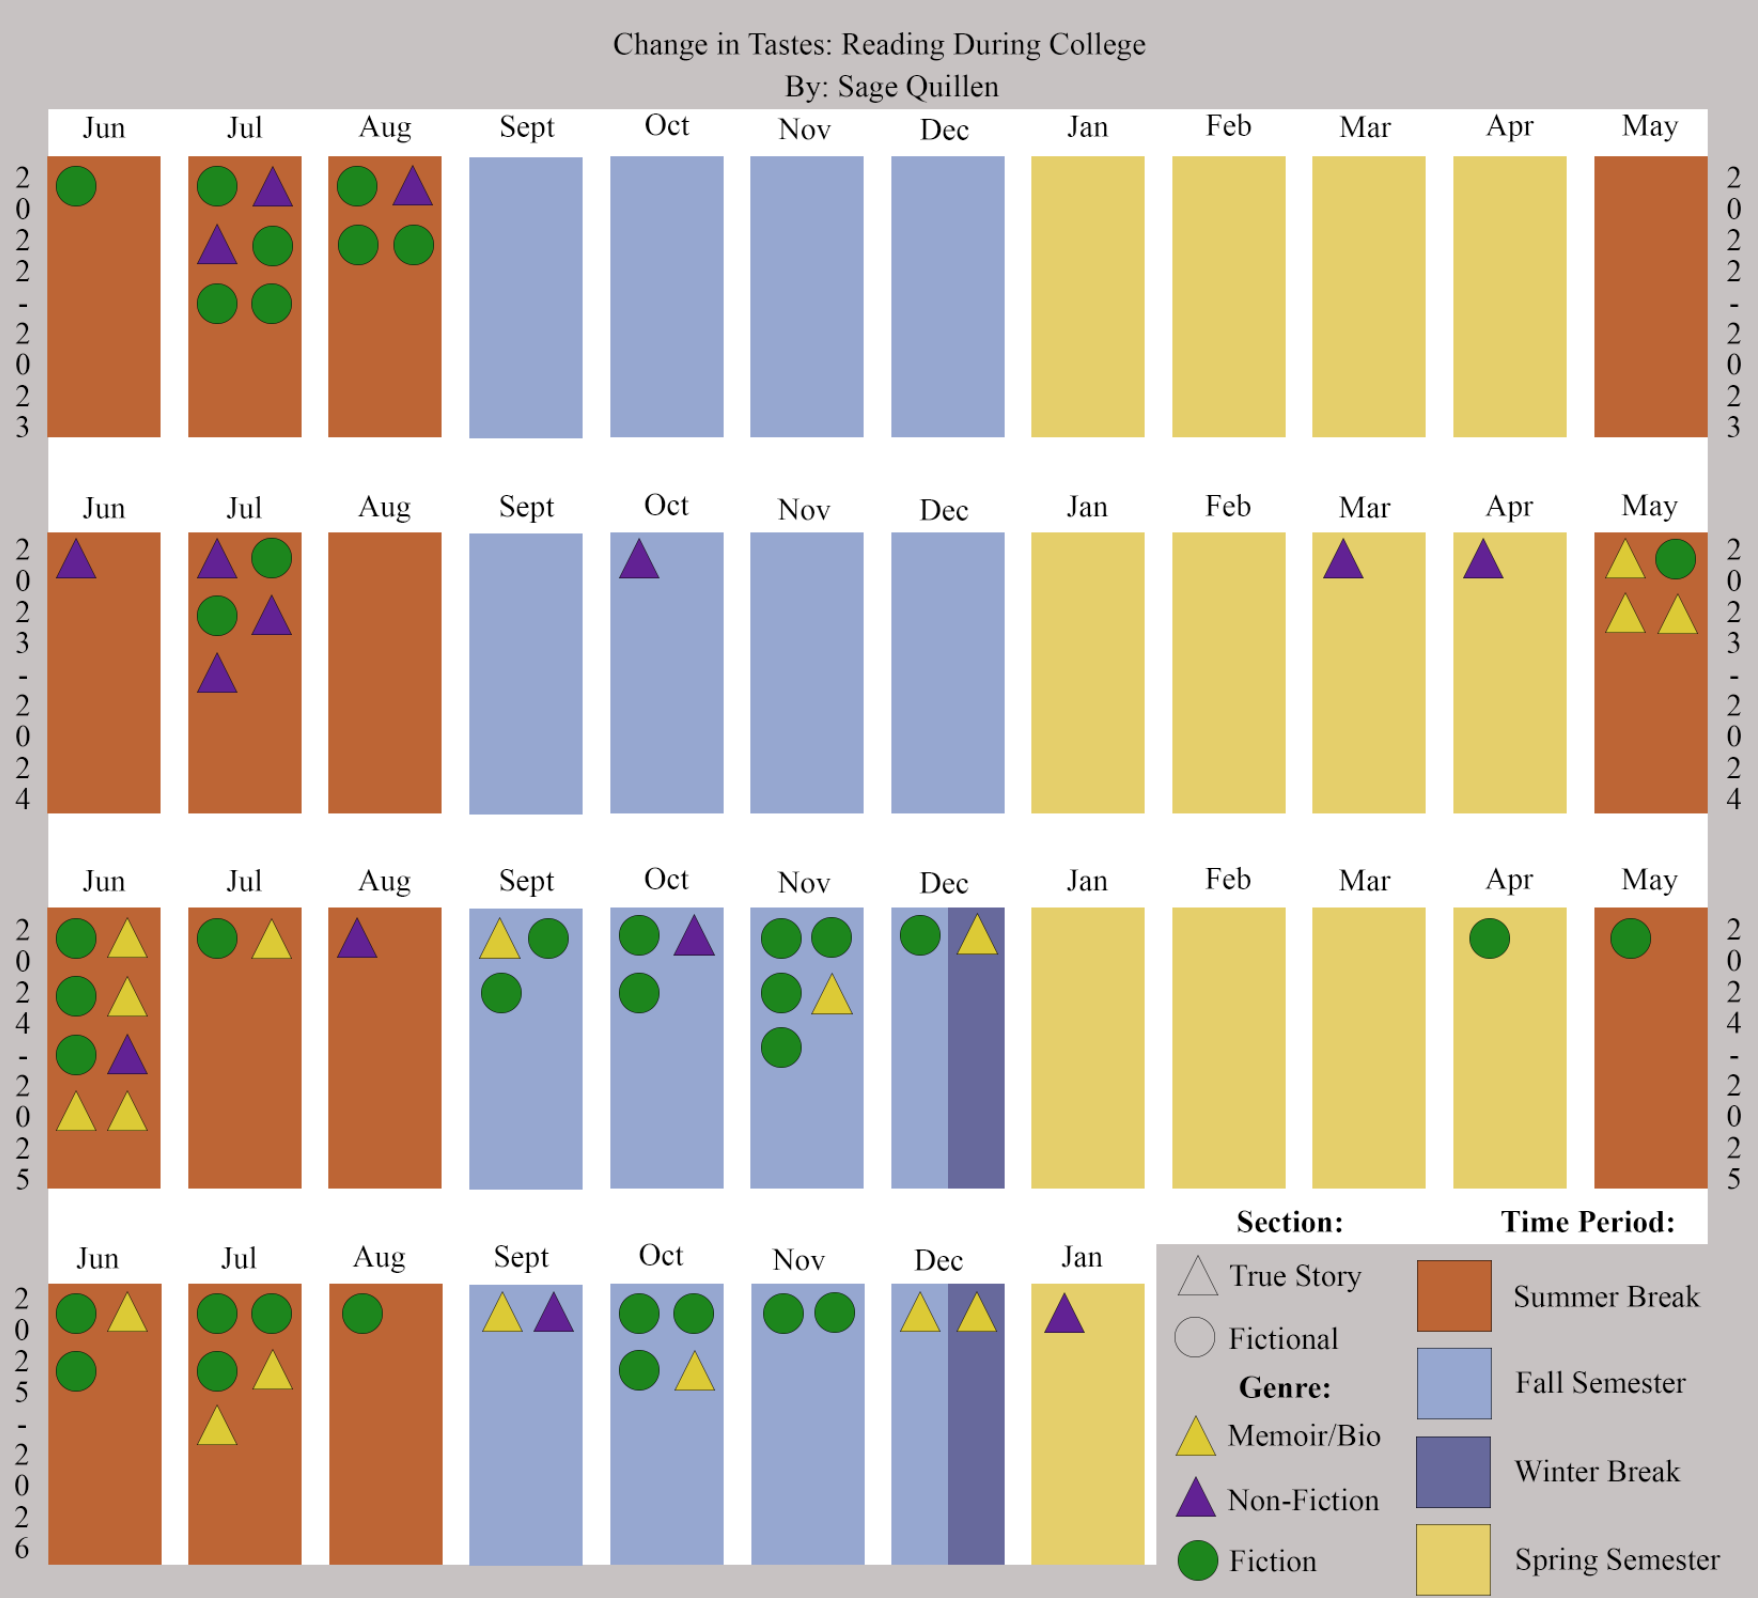
This data shows, since I graduated from high school, when I read books and what type. I wanted the visualization to be clear in the distinctions of breaks in the academic year. I was interested in how college has affected/affects my reading as I observed an striking influx of reading in summer.
