
Tag: excel
-
Undergraduate | Submission 4 – Second Place
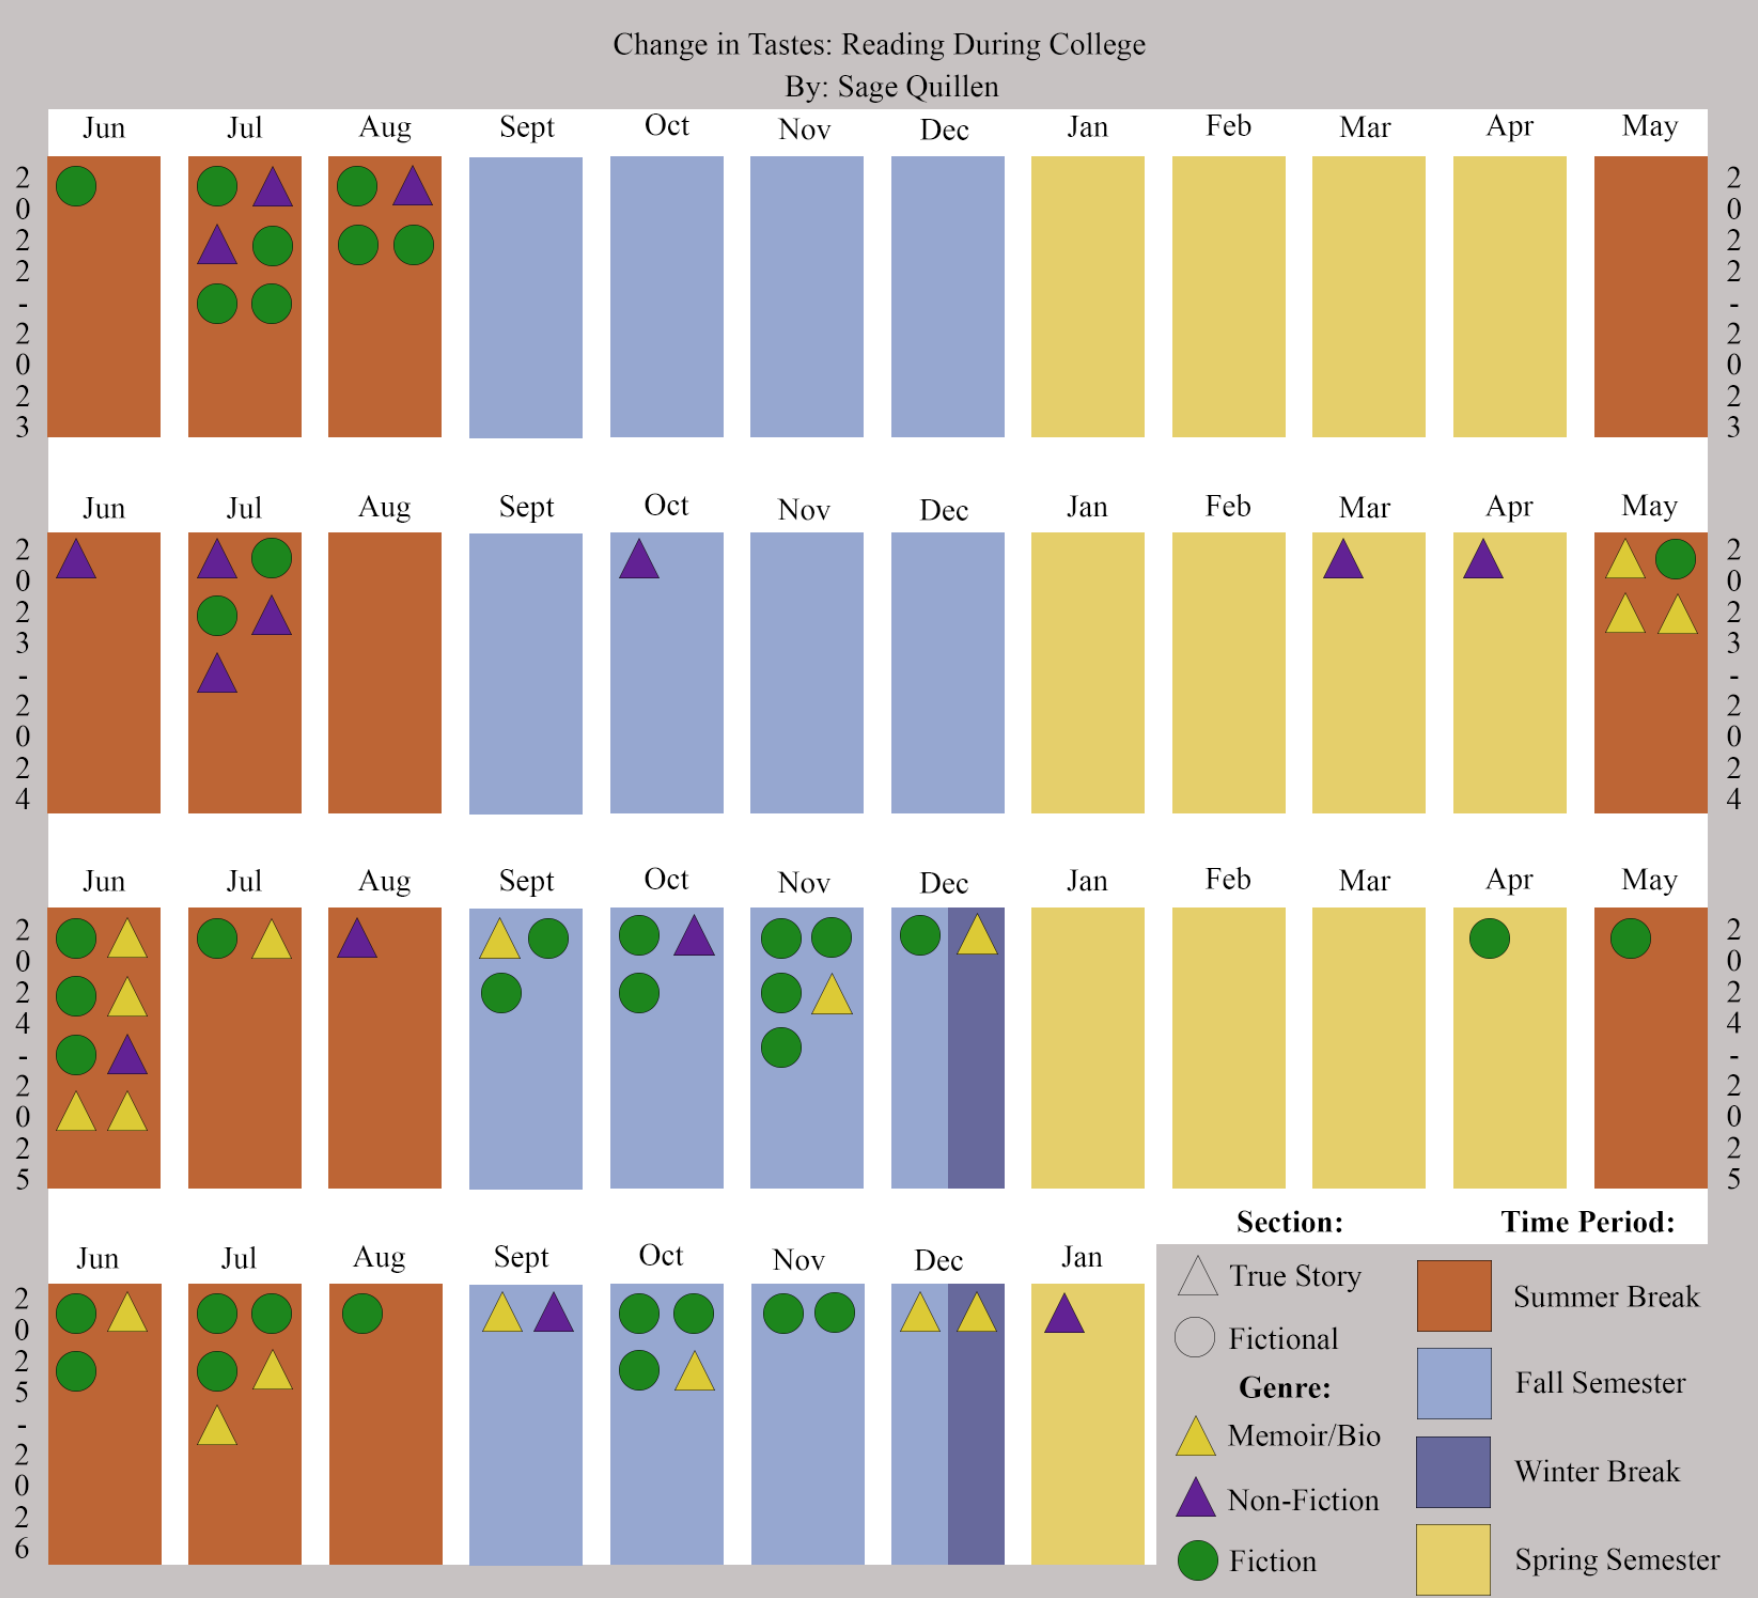
Creator: Sage Quillen Source Data: Creator Statement: This data shows, since I graduated from high school, when I read books and what type. I wanted the visualization to be clear in the distinctions of breaks in the academic year. I was interested in how college has affected/affects my reading as I observed an striking influx…
-
Undergraduate | Submission 3 – Third Place
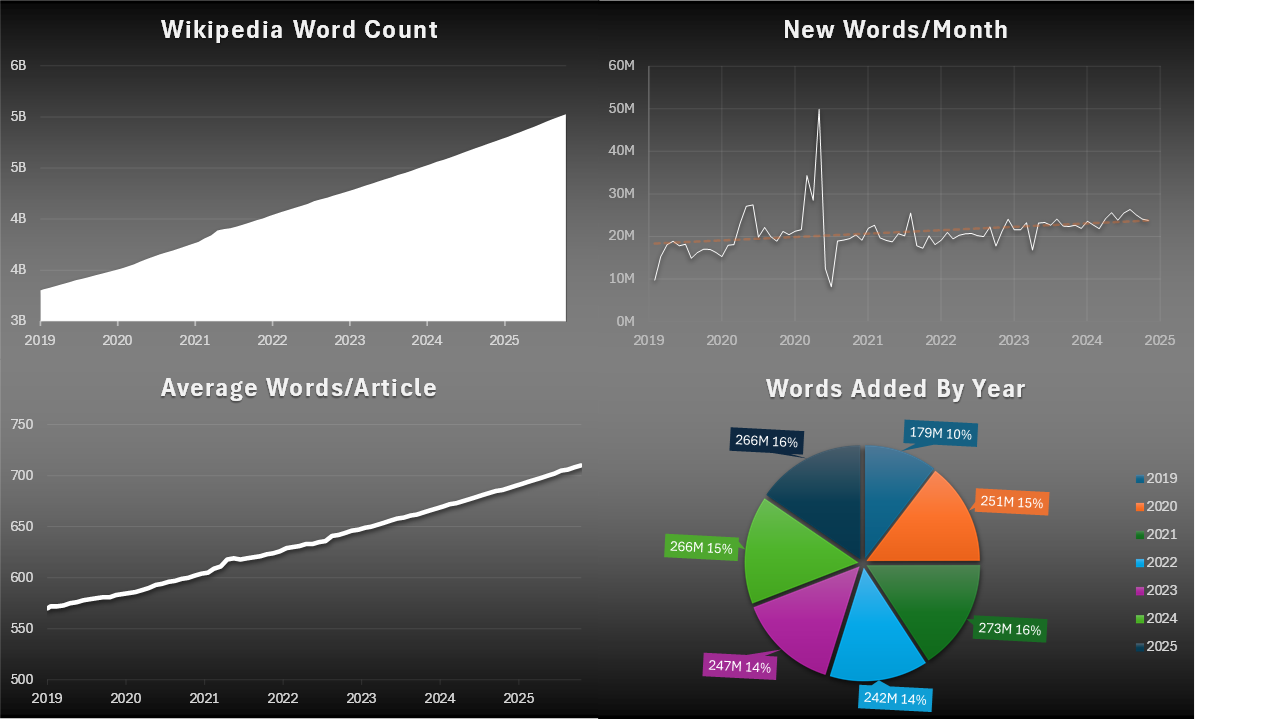
Creator: Christopher Horak Creator Statement: I simply wanted to use excel and implement different charts to showcase an interesting set of online data. I used data about the amount of wikipedia words from 2019 to 2025. This was mainly to explore some excel formatting and functionalities. I was trying to show the linear increase in…
