
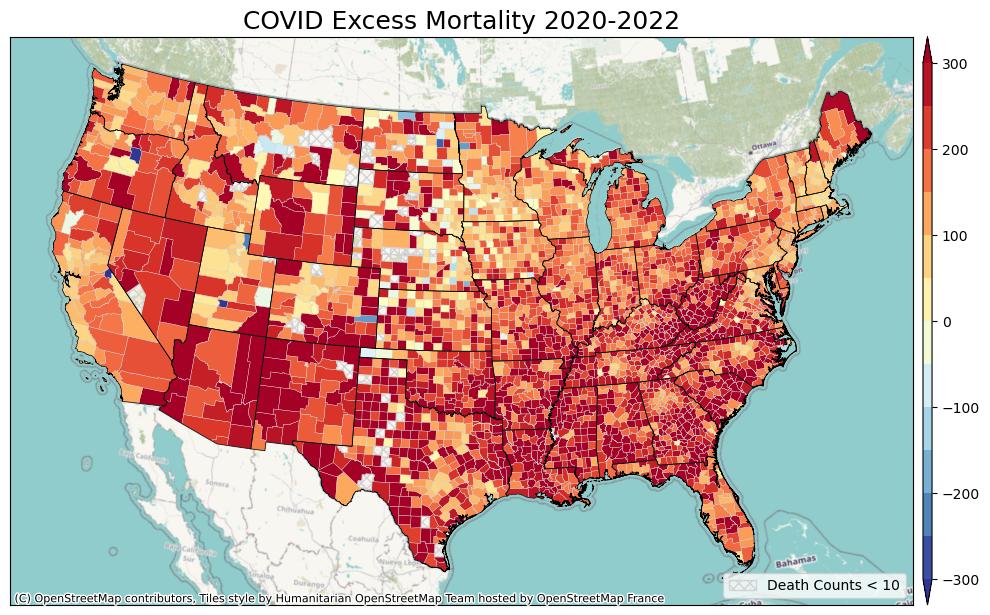
Creator: Chen-Lun Kao & Stewart Fotheringham
Creator Statement:
Most prior COVID-19 research has focused on disease incidence, rather than excess mortality, which provides a more comprehensive measure of the pandemic’s impact. The accuracy of officially reported COVID-19 deaths has been affected by factors such as limited testing capacity, evolving case definitions, and reporting delays, especially during the early stages of the outbreak. These challenges contributed to underreporting and misclassification of deaths. As a result, excess mortality has become a more reliable metric for assessing the pandemic’s true impact. In contrast to official death counts, excess mortality includes not only confirmed COVID-19 fatalities but also deaths that were misdiagnosed or indirectly caused by pandemic-related conditions.
County-level multiple causes of death rates from 2015 to 2022 were obtained from the Centers for Disease Control and Prevention (CDC). The CDC’s procedure was used to calculate the five-year average death rate for 2015–2019, establishing a baseline county-level death rate prior to the COVID-19 pandemic. Using this baseline, the average crude death rate for each county was computed for the period January 2020 to December 2022.
Counties with fewer than nine deaths were excluded from the analysis in accordance with CDC guidelines.
Excess mortality is visualized using a diverging color scheme: blue indicates fewer deaths than expected based on the previous five-year death rate, while light yellow through dark red represent increasingly higher levels of excess mortality. Our map reveals significant geographic variation in excess mortality across the U.S. Notably, counties in the Southern and Midwestern regions exhibit particularly elevated excess mortality.
