
Creator: Stephen Liwur
Creator Statement:
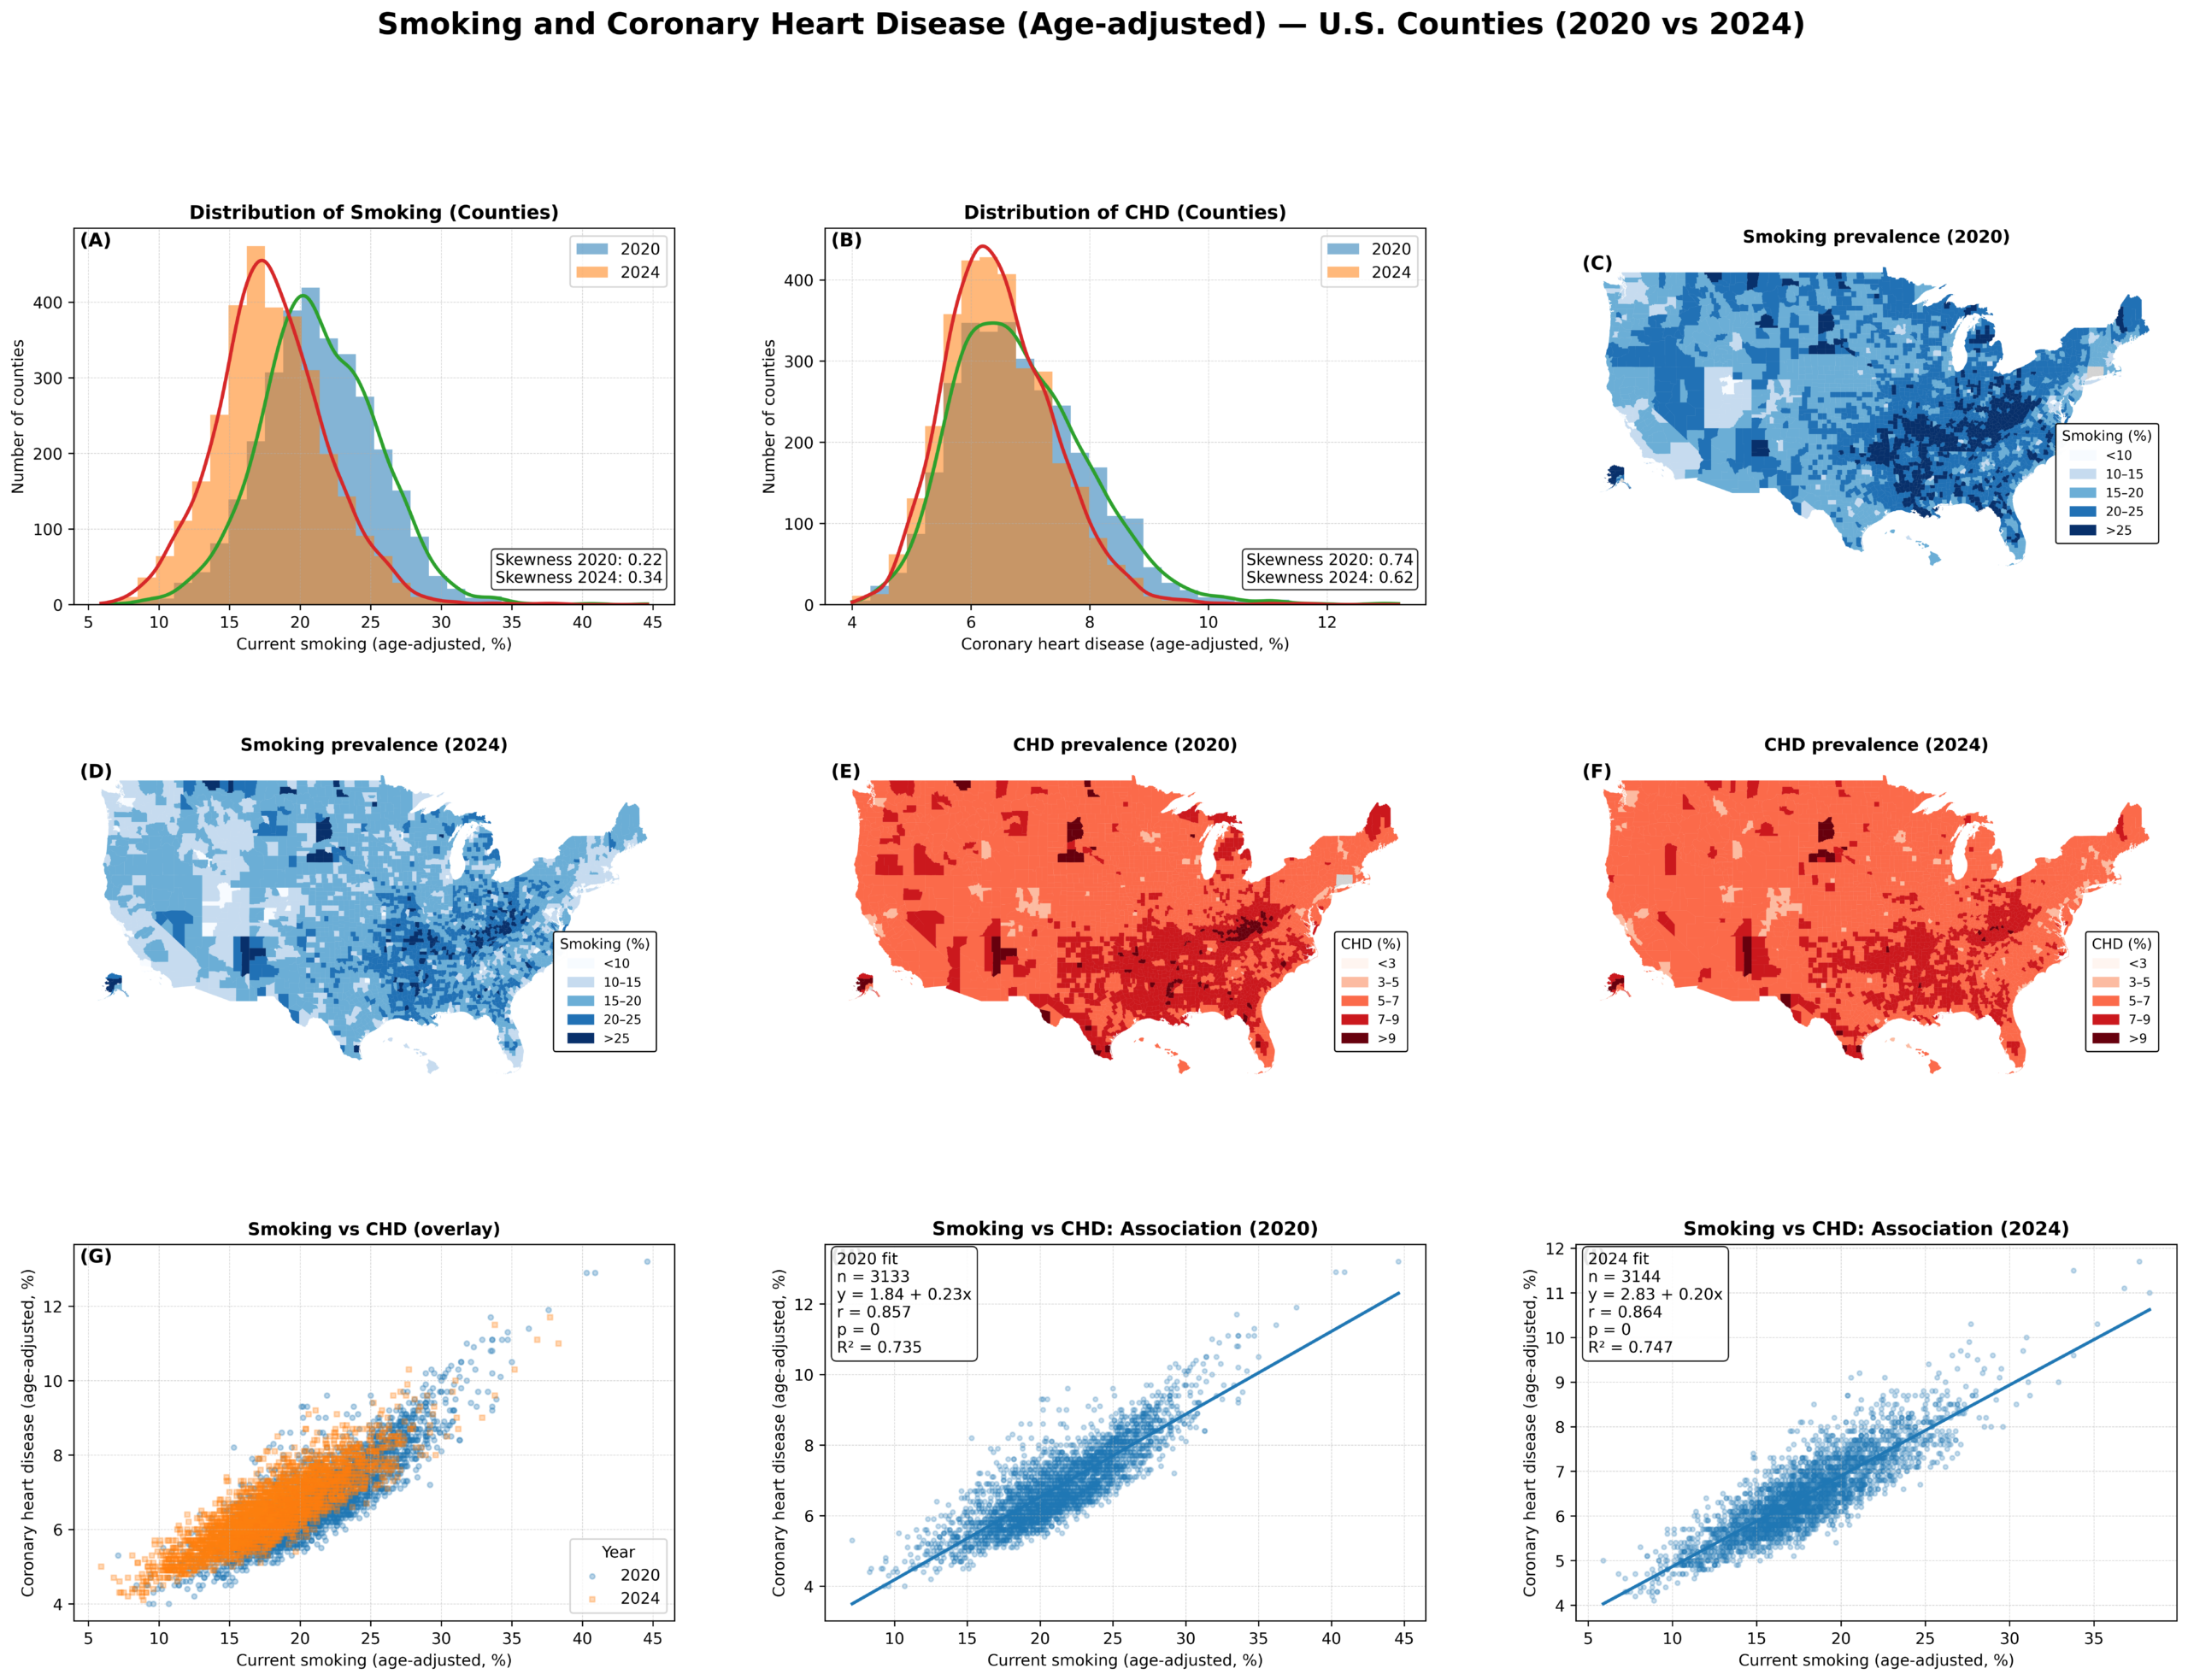
This visualization analyzes how cigarette smoking and coronary heart disease are spatially distributed across U.S. counties and how closely the two outcomes are connected over time.
Smoking, according to existing studies (e.g., Alhindal et al., 2025; CDC, 2024), is a major and well-established risk factor for cardiovascular disease, yet its health consequences are not evenly experienced across communities.
The purpose of this visualization is to demonstrate how place shapes exposure to smoking and the burden of heart disease, and how their relationship persists over time. The data are drawn from the U.S. Centers for Disease Control and Prevention’s PLACES project, which provides county-level, age-adjusted estimates of health behaviors and chronic conditions. The visualization compares smoking prevalence and coronary heart disease (CHD) prevalence in 2020 and 2024. The top panels show the distribution of each outcome across counties, highlighting differences in central tendency, spread, and skewness between years. The middle panels map these outcomes, revealing clear and persistent regional patterns, particularly across the Southeast, Appalachia, and the Midwest. The bottom panels examine the relationship between smoking and heart disease, where the scatterplots and fitted trend lines show a significant, positive association in both years. This suggests that counties with higher smoking prevalence consistently experience higher rates of CHD. While the visualization does not claim direct causation, it highlights a stable population-level relationship. It emphasizes that public health risks are spatially patterned and closely tied to socio-geographic context, accenting the continued role of smoking in shaping cardiovascular disease burden across U.S.
