
Category: Graduate
-
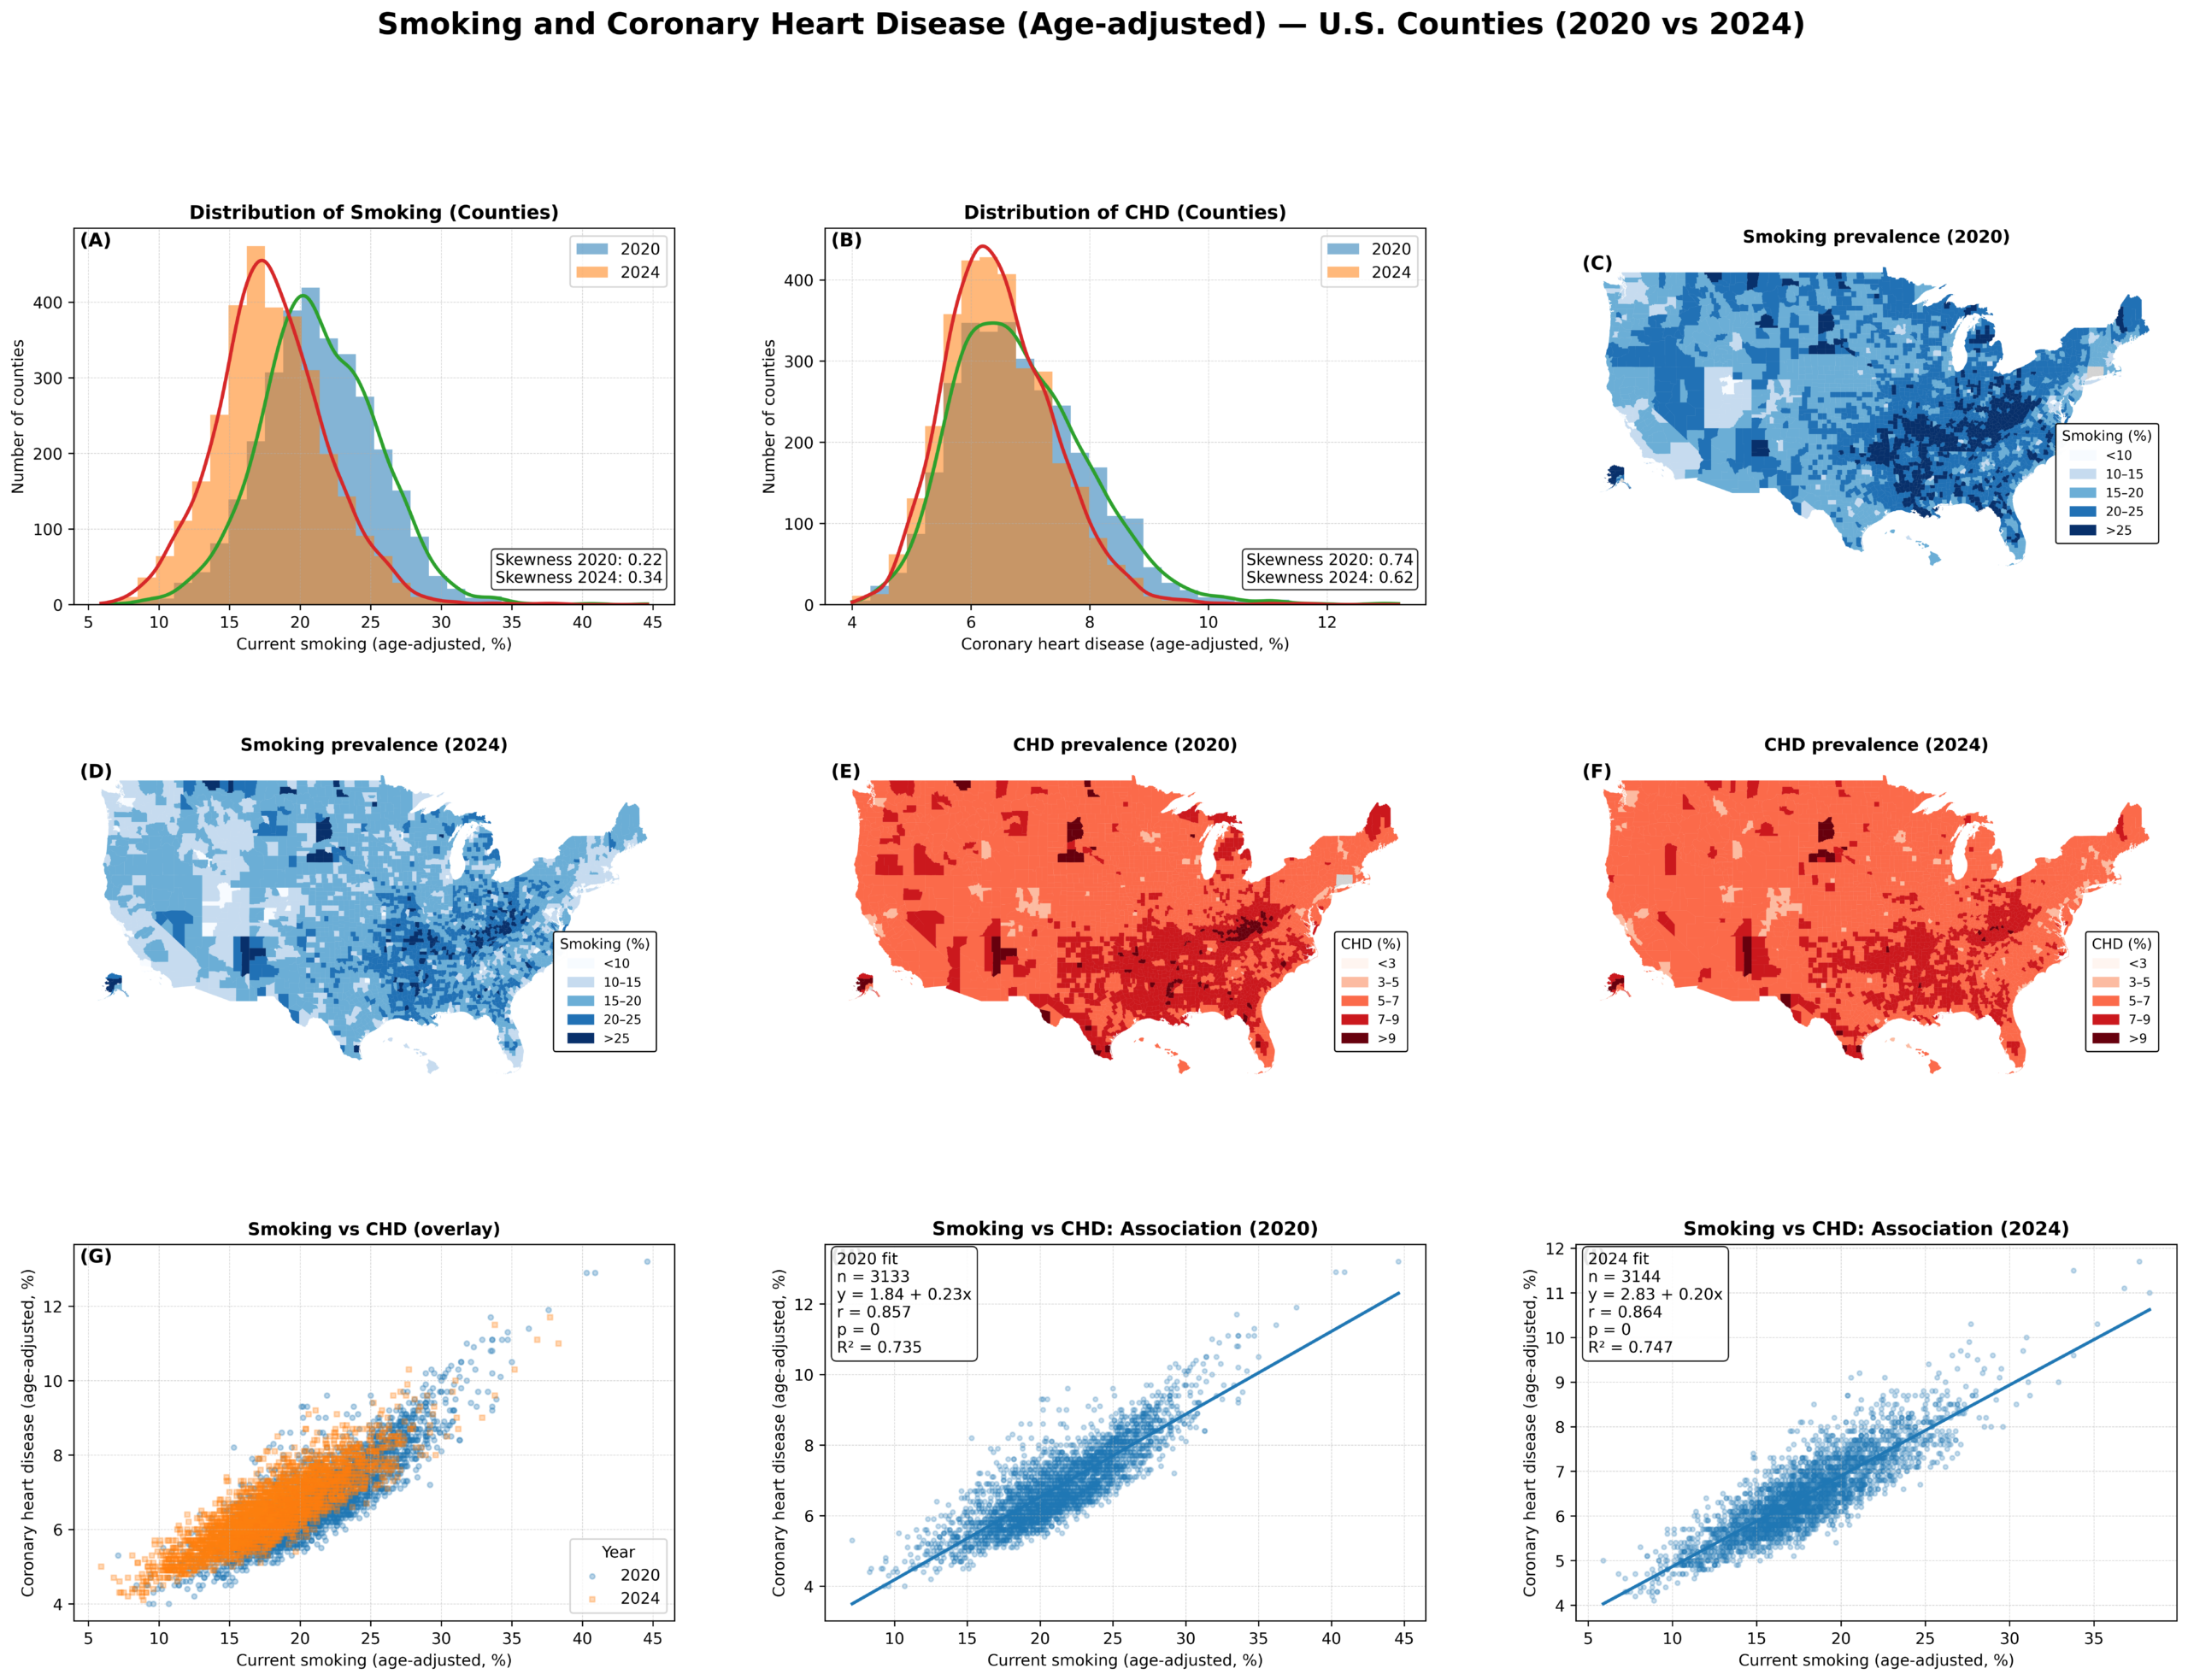
Graduate | Submission 6 – First Place
Creator: Stephen Liwur Creator Statement: This visualization analyzes how cigarette smoking and coronary heart disease are spatially distributed across U.S. counties and how closely the two outcomes are connected over time. Smoking, according to existing studies (e.g., Alhindal et al., 2025; CDC, 2024), is a major and well-established risk factor for cardiovascular disease, yet its…
-
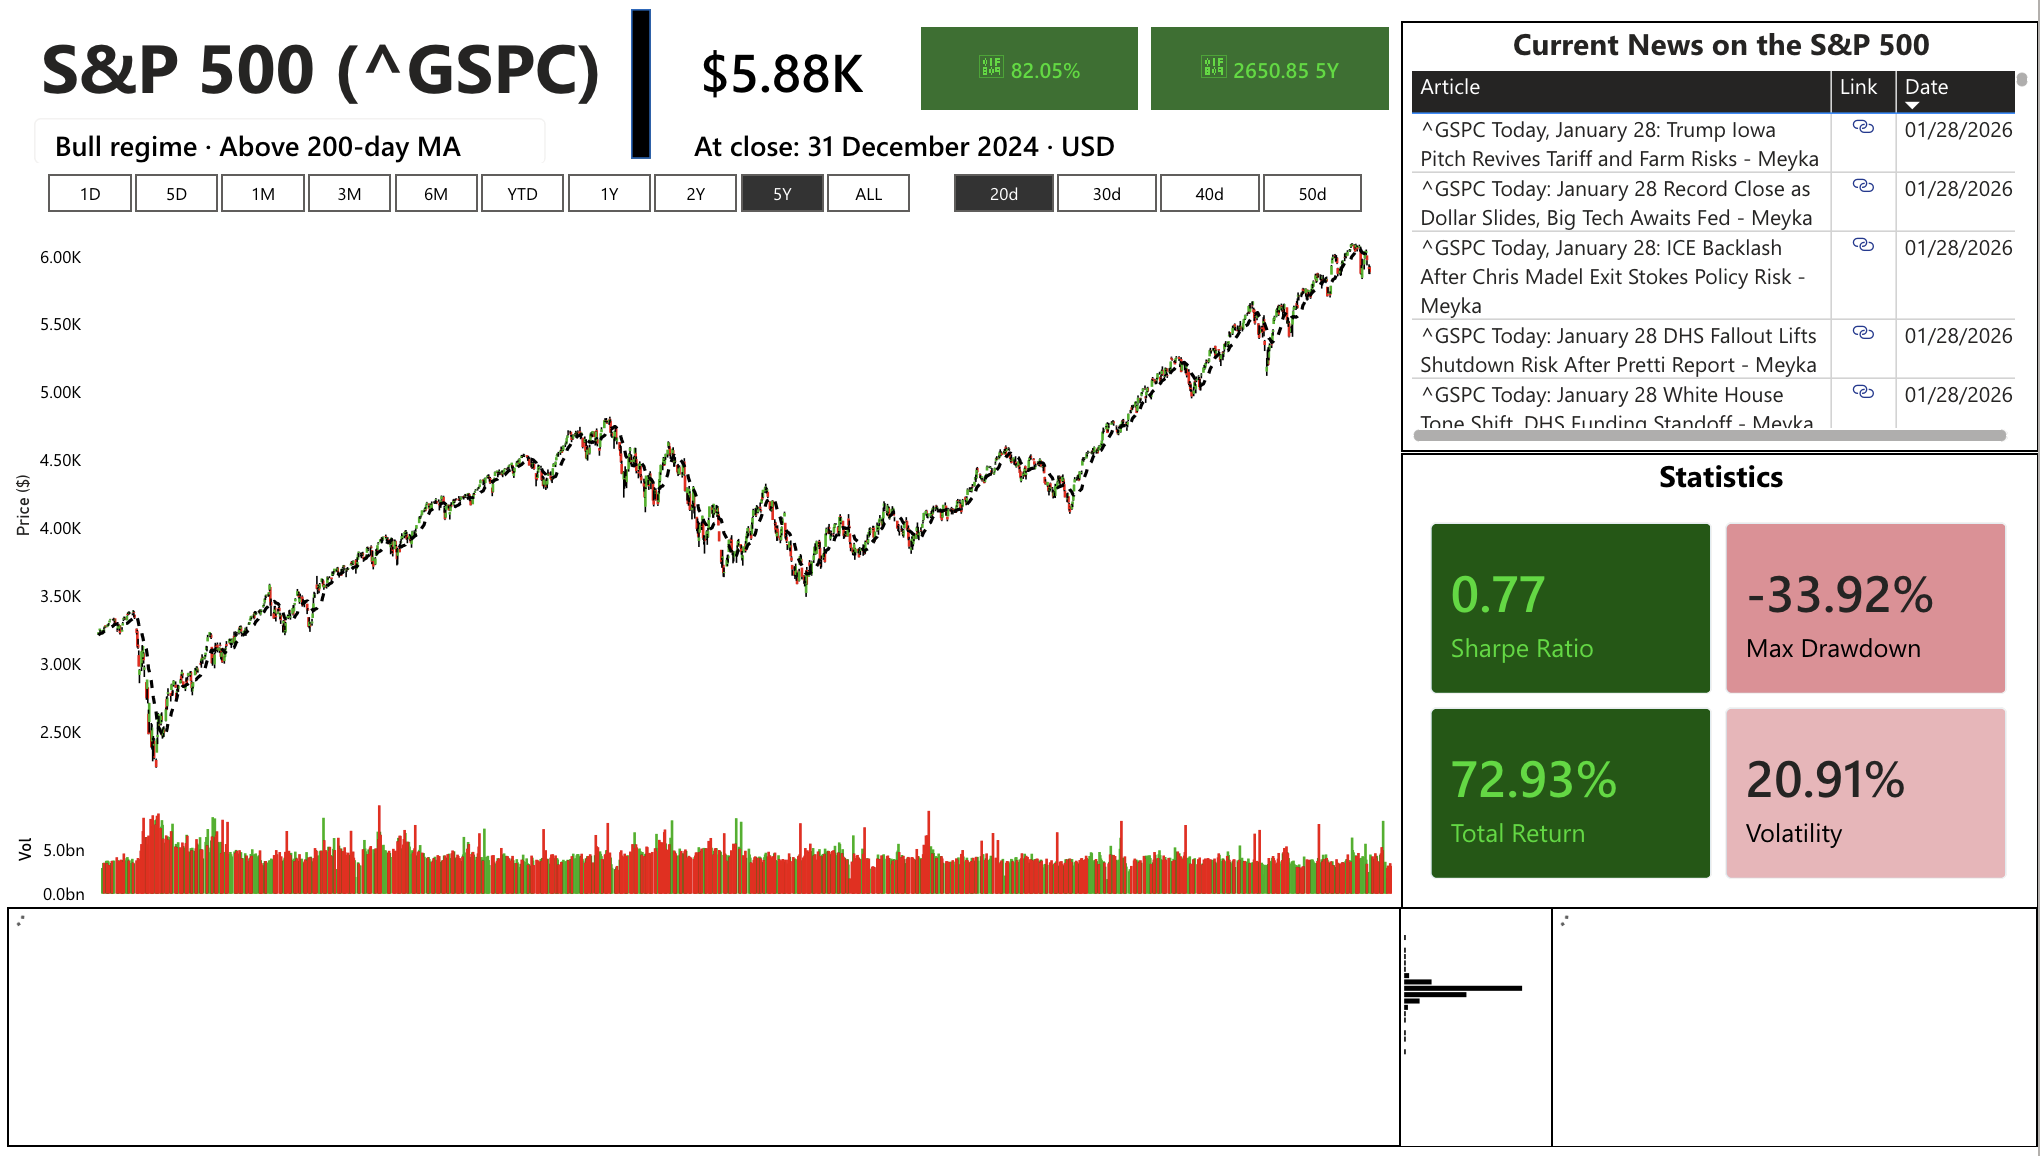
Graduate | Submission 5 – Third Place
Creator: Dennis Houlihan Note on data: Stock data was taken from yahoo finance via python through the yfinance package with the dates specified. Creator Statement: This dashboard was an attempt to provide a user easy-to-use and digestible visualizations and statistics to help them understand and analyze the S&P 500. The data is comprised of open,…
-
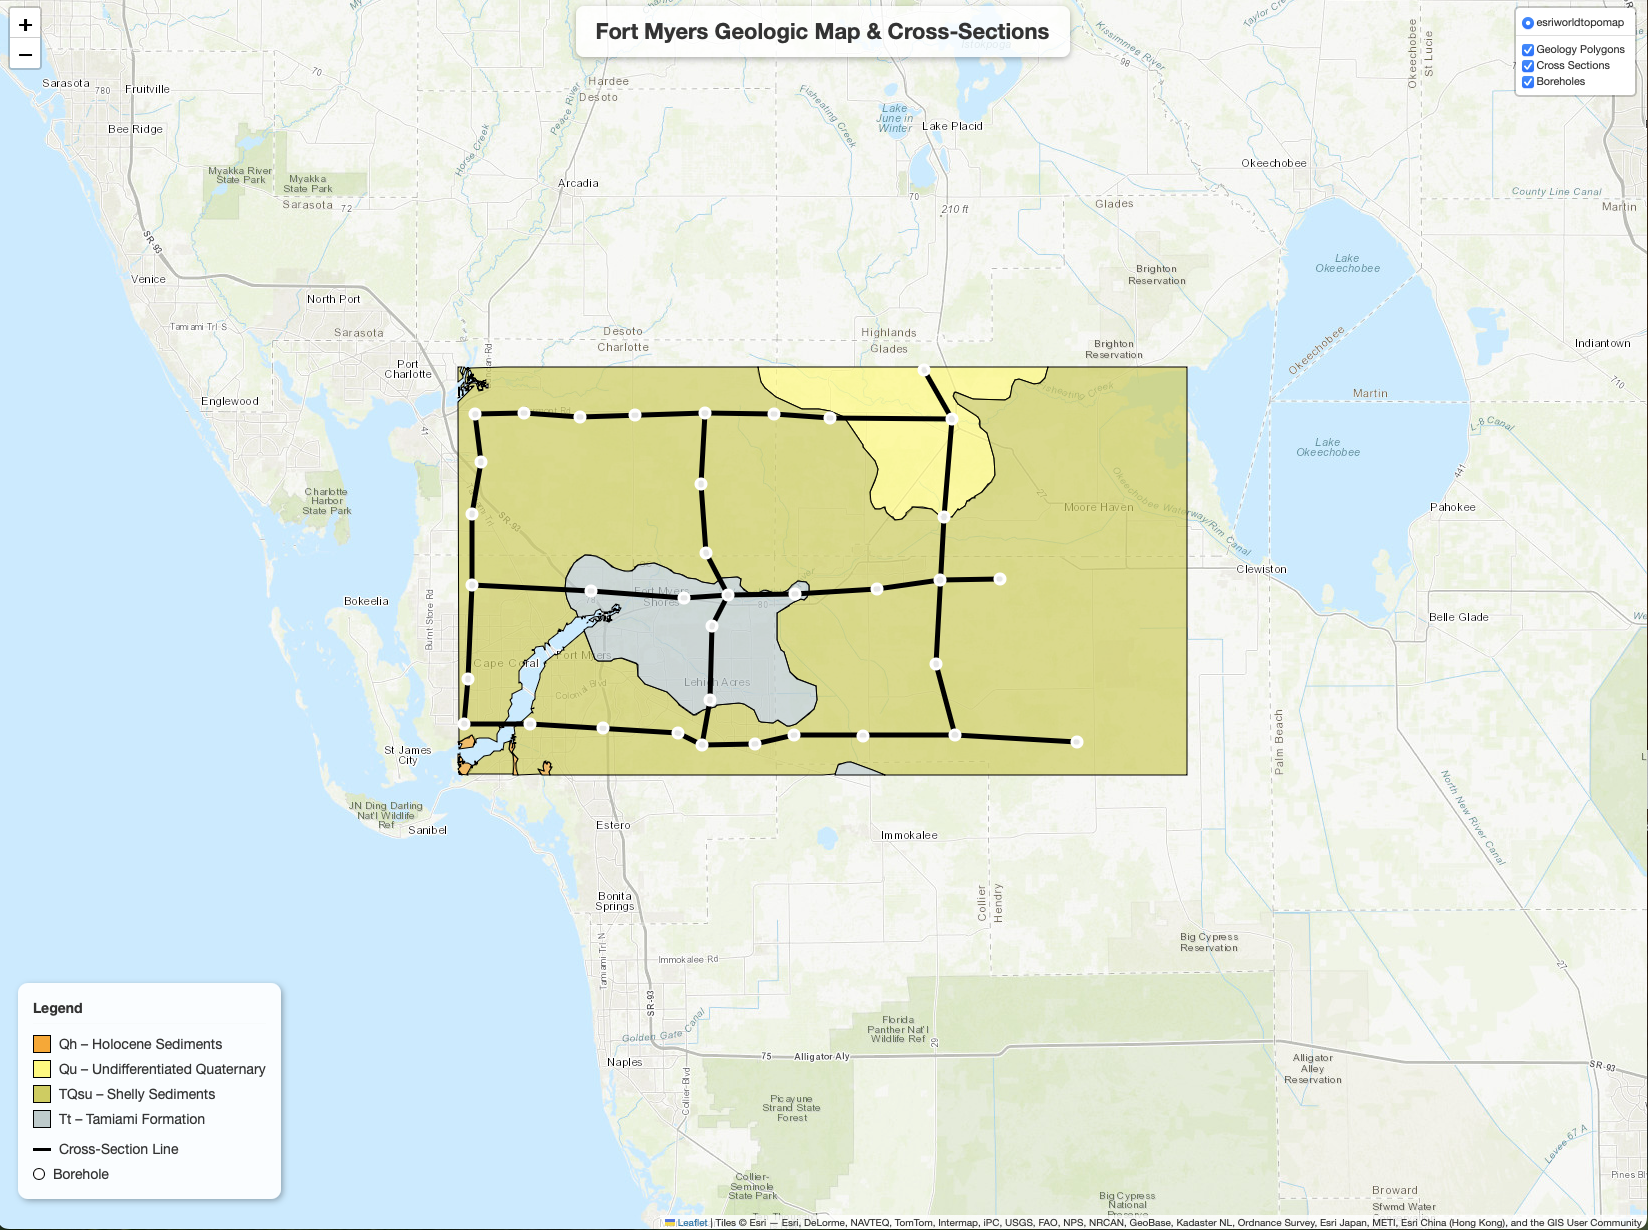
Graduate | Submission 1 – Second Place
Creator: Sean Jones Creator Statement: I created an interactive map of the geology found in the Fort Myers quadrangle using only python and html programming code. In this interactive map, you can click on any geologic formation and a pop-up showing the description will appear. The depths and formations found in each borehole also appear…
