
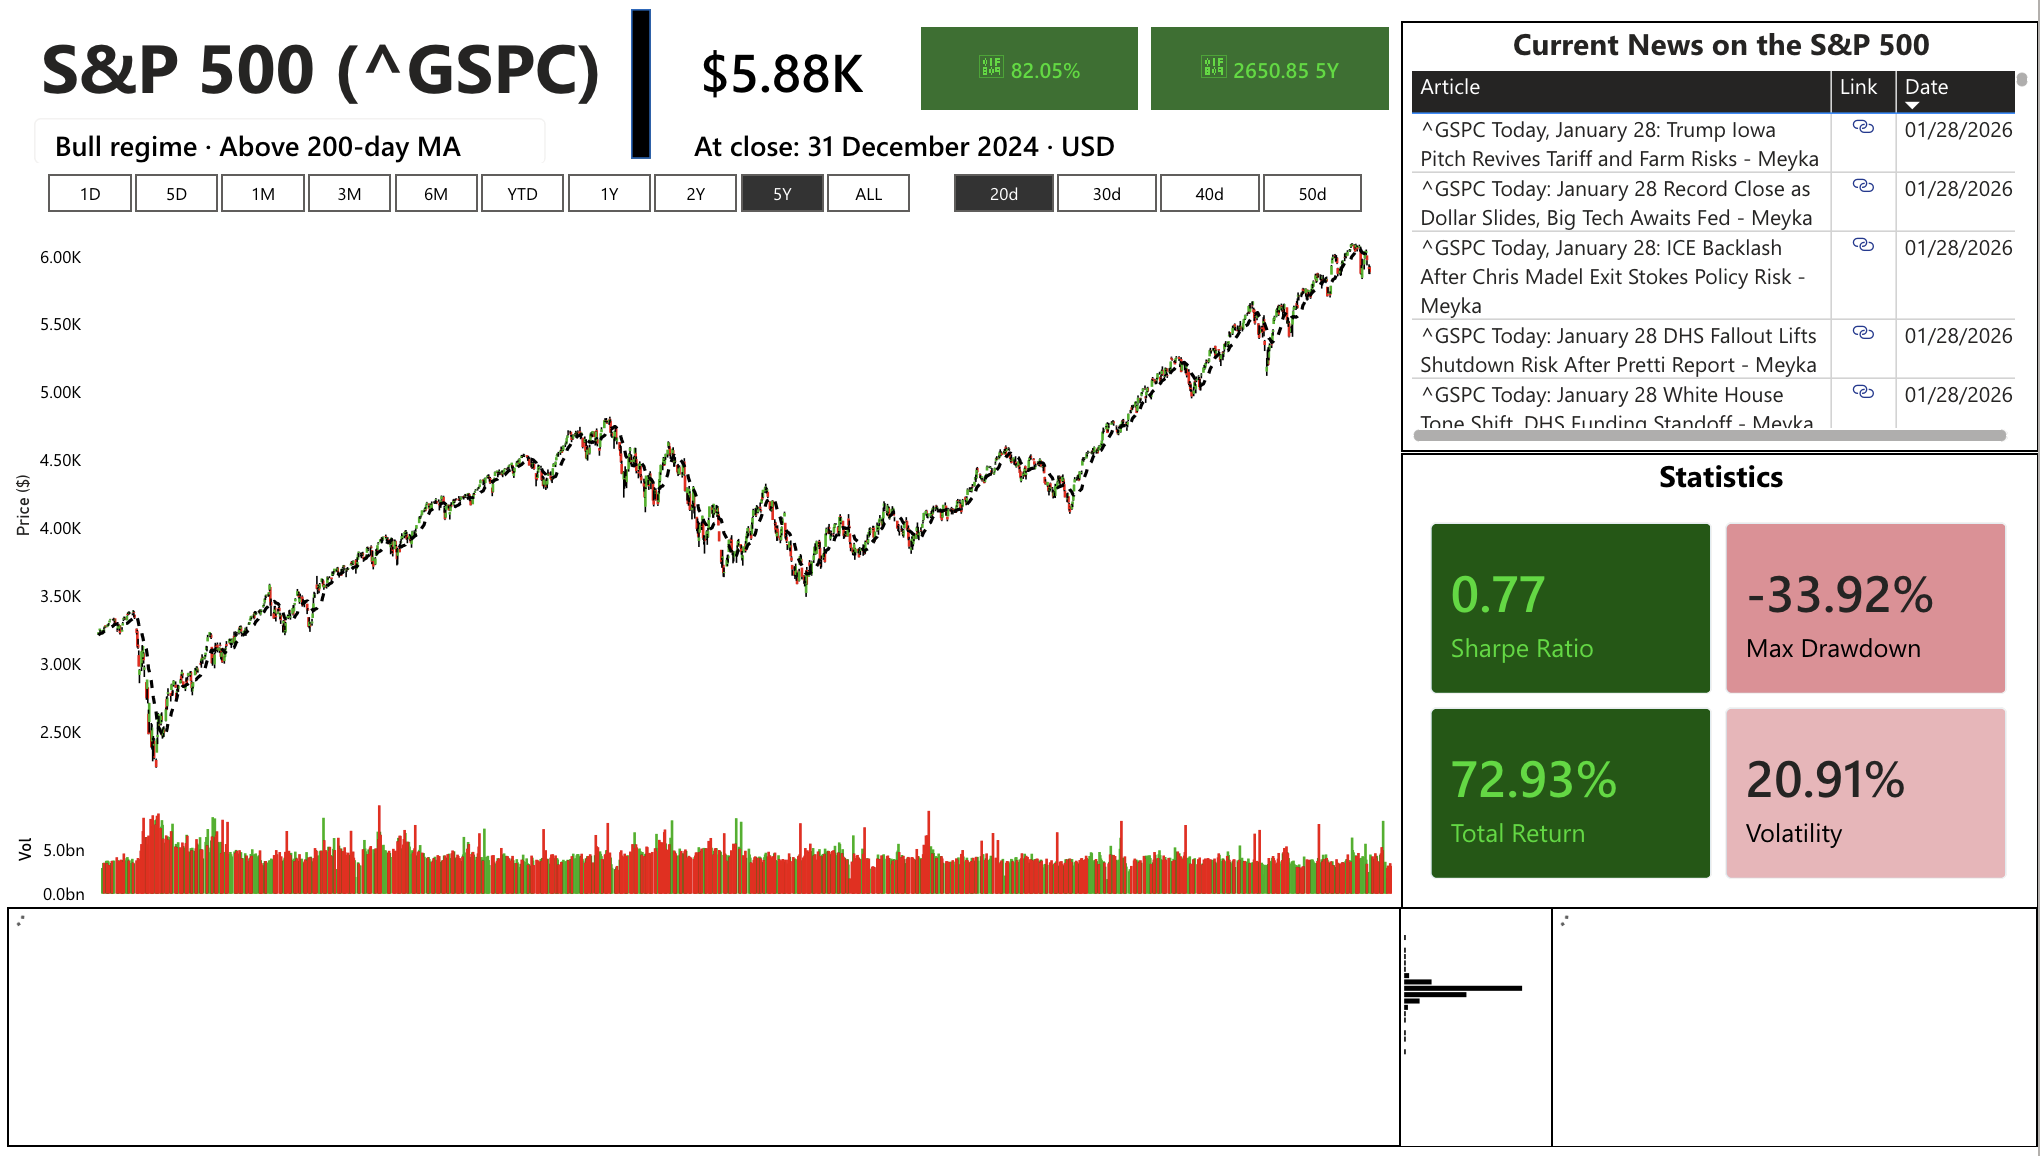
Creator: Dennis Houlihan
Note on data: Stock data was taken from yahoo finance via python through the yfinance package with the dates specified.
Creator Statement:
This dashboard was an attempt to provide a user easy-to-use and digestible visualizations and statistics to help them understand and analyze the S&P 500. The data is comprised of open, close, and volume data from January 1, 2000 to December 31, 2024. It also includes recent news taken from google news to keep the user up-to-date with the latest news and stories.
I was inspired to do this because I am currently trying to get into the quant finance field. I have been working with finance data and attempting to make models and trading strategies, but have not put much effort into data visualization. Furthermore, while there are a lot of finance applications, they are often very noisy and confusing. I wanted to make something simple yet informative.
