
Creator: Alexis Moser
Creator Statement:
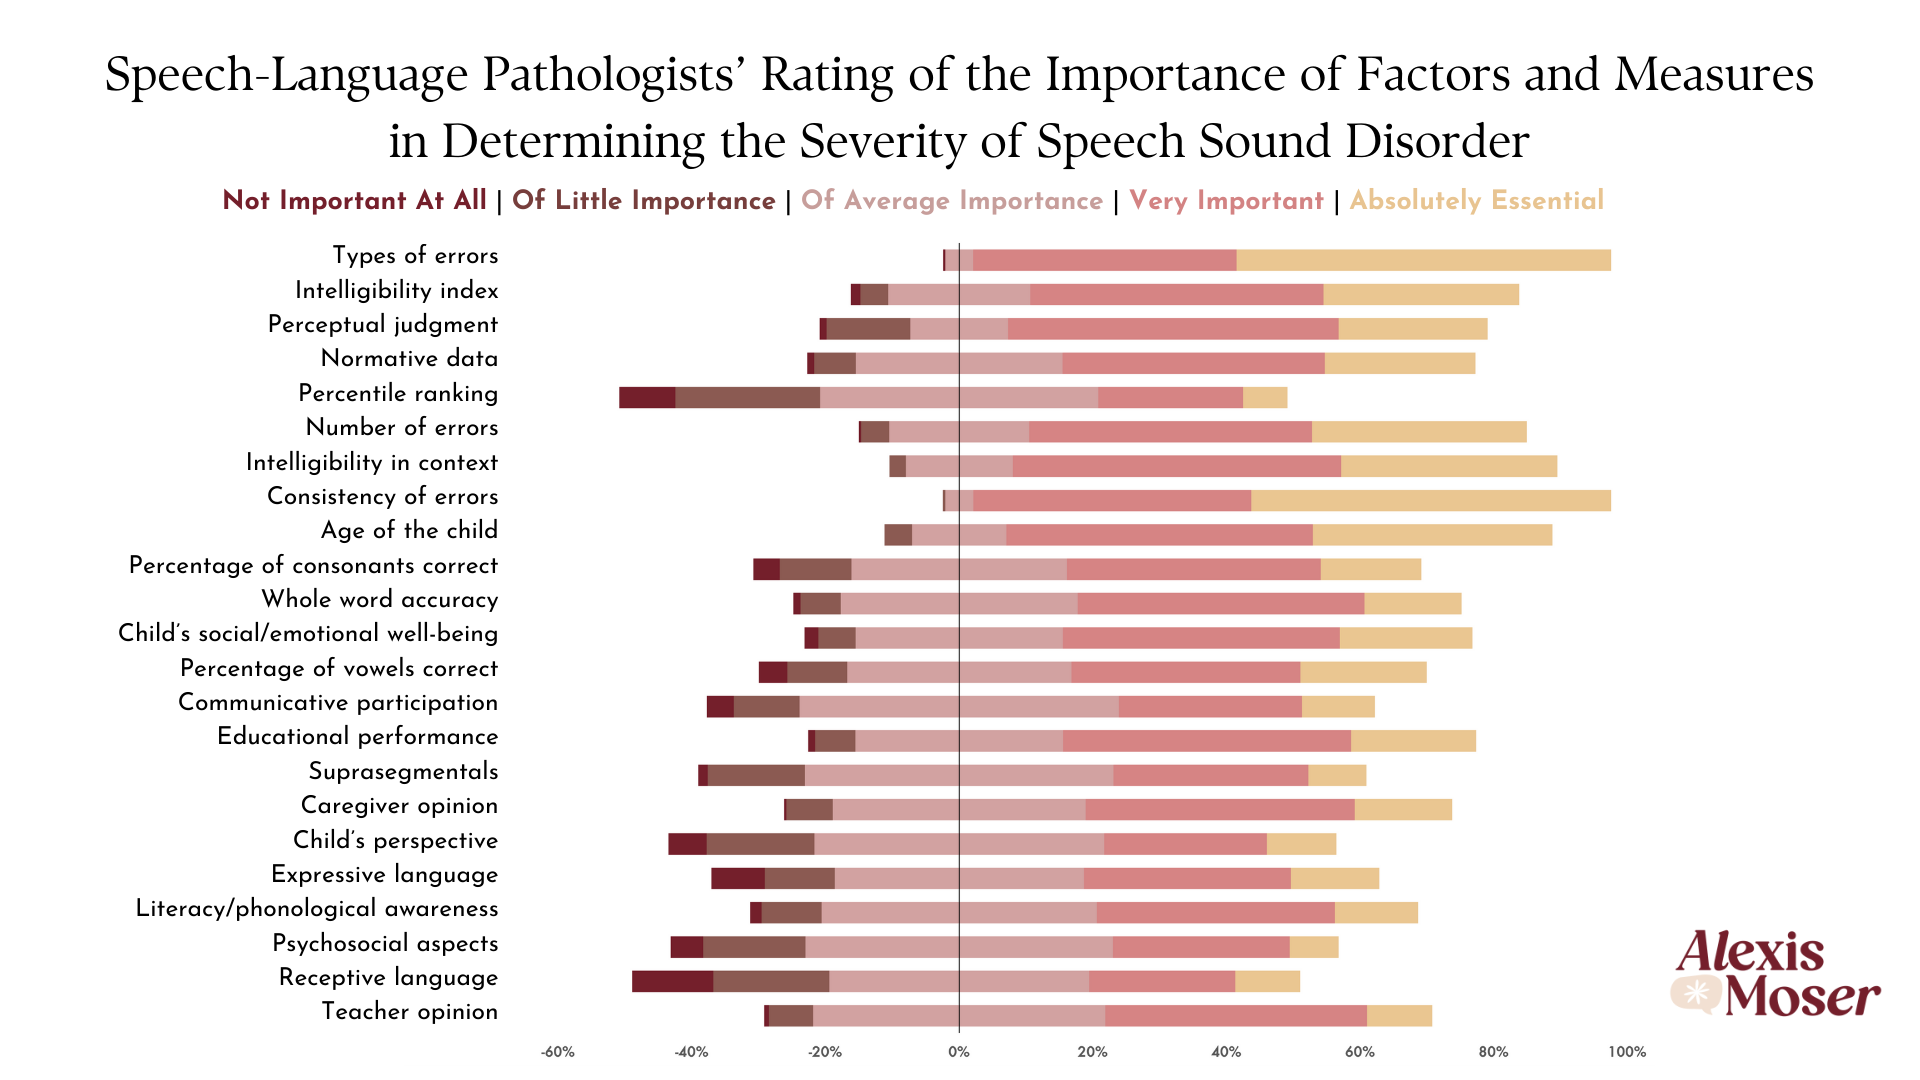
This data visualization presents unpublished results from my master’s thesis examining speech-language pathologists’ (SLPs’) perceptions of the severity of speech sound disorder (SSD). Through a national survey, SLPs (n = 296) rated the importance of 23 different factors and measures in determining SSD severity using a Likert scale ranging from “Not Important at All” to “Absolutely Essential.” Prior literature describes substantial variability in how clinicians judge severity due to the lack of a gold standard. Most prominently, Shriberg and Kwiatkowski (1982) found that SLPs identified up to 15 factors when asked open-endedly about severity ratings for SSD. When my study was published in the American Journal of Speech-Language Pathology, we chose to highlight the top five factors selected when respondents were asked to identify the single most important factor they use to determine severity. The submitted visualization revisits a different question from the same survey in which respondents rated the importance of each factor. This contest inspired me with the opportunity to explore an organized yet expressive way to present a complementary perspective beyond an ordered list. Using frequency distributions of Likert responses, I created a diverging stacked bar chart to show the direction and strength of ratings. The factors are ordered based on the proportion of respondents who selected them as number one to align with the published findings. My visualization tells the story that SLPs rely on many different, often overlapping factors, emphasizing that SSD severity is not defined by one score but by multidimensional clinical judgment.
